Tuesday, July 31, 2007

200707 - Month-end Review

2 Wins and 8 Losses

  • I managed only 10 trades this month because of 2 week-long business trip that drove me away from my desk
  • I have also tried to be more selective in my trades (although it doesn't appear so if you look my entires this month), and therefore, even on the days that traded, I made very few trades
  • Overall, I don't feel that I have improved much in trading during this past month
  • Instead, I even think I'm trading worse that I used to
  • Sometimes I even felt like I just wanted to make an entry to get involved... sort of like out of boredom. This is definitely something that I need to address
  • About the only positive note from July's trading is that I managed to limit my lost
  • My biggest loser of the month was -0.66%; My biggest winner was a +1.34%
  • Now I just need to work hard, and improve on my entries!
Thank you for reading! I hope my readers had a profitable July!

073107 - CBG - 15mins - Gain*Paper


Symbol: CBG
Type: Long
Entry: During the 11am bar
Exit: Half at 1pm, and half at 1:30pm
Result: Gained +0.55%

  • Not the perfect set-up, but I'm happy because I didn't lose money on this trade
  • I entered after the Hammer-type candle on the 6th bar with increased volume. My initial target at the Opening High
  • The prices failed to rise soon after entry, and I re-adjusted my Target to the high of the 2nd and 3rd candle
  • It reached my target price and I exited half of my position
  • The prices went further south, and I exited my remaining position at a lost of a penny
  • Overall, I still managed to profit from this trade, which I am very happy about it
  • It's a rather positive note to end the month of July

Monday, July 30, 2007

No entries today!

I did tried to trade today, but I couldn't spot any decent entires. In fact, my shortlist came out to be a rather short one. There's one more trading day left for July. I felt like the entire month of July went to waste. I thinking I only participated 50% of all the available trading days this month because of the 2 weeks business trip that took me out of my office.

The one positive note that I can take from being away from the office is that I managed to catch up on my trading-related readings. Which is something that I'm still trying to balance. It's kind of like a balance between the Classroom hours vs. Lab hours.

Anyway, I hope my readers managed some profitable trades. Do feel free to share!

Friday, July 27, 2007

Ameritrade vs. eTrade feed


  • This is really frustrating!
  • I have an Ameritrade account from years ago... which I do not have a penny in it for the past few years. I have transferred all the money into my eTrade account
  • Since the account is still valid, when I was introduced to QuoteTracker (QT), I set it up in QT that it will use my Ameritrade account to get the feed
  • Sadly, this is the second time this month that I noticed a discrepancies in charts, between QT/Ameritrade and eTrade
  • I don't ususally log into my eTrade account these days since I'm still Paper Trading
  • But today, I was logged-in to eTrade to update my account balance, and while I was there, I wanted to observe how the Level II quotes appear on CROX. (I dont' usually have time for Level II when I'm trading from work.)
  • When I pulled up the chart in eTrade, I immediately noticed a different between my QT chart and eTrade chart
  • From the charts above... the white background is QT/Ameritrade, while the black background is eTrade
  • You can easily see that the 3rd circle from the left shows a gap-down in QT, but such gap does not exist in eTrade
  • The 1st and 2nd circles from the left shows that the Upper and Lower shadows are clearly different between the two charts!
  • The same applies to the remaining 3 circles on the right... the shadows are clearly different between the two charts!
  • My work has exposed me to identify theft prevention, etc., and one of the reason why I chose to use the Ameritrade feed is the fact that it has no money in that account
  • If I have to provide my User Name and Password to QT, and then relying QT to log in to my eTrade account... the 'anal' side of me is worried that the QT might mis-handle my log-in information. Basically, how am I supposed to know if QT is not secretly sending my log-in info to somewhere/one else?
  • But since it appears that a lot of full-time traders are also using QT, which I have to believe that their account balance gotta have a few more zeros than mine, I guess I am just worrying too much... I hope
  • Besides, eventually, I know I have to move-on to something else. eTrade or not. Because Ameritrade's feed is simply INCORRECT! Maybe it's time for me to switch to eTrade feed, at least for now
To my 3 loyal readers, if you have a suggestion, I would like to hear from you.

Have a good weekend!

072707 - MHS - 5mins - Loss*Paper

Symbol: MHS
Type: Long
Entry: During the 14:30 bar
Exit: During the 15:40 bar
Result: Lost -0.25%

  • I really need to stop myself from entering trades so late in the day
  • I kind of knew that I entered this trade out of bordom
  • I haven't been trading for 2 weeks, and today I took some time off work, just so I can sit in front of the computer to (paper) trade a few.... yet there were hardly any signals
  • I drew the yellow to indicate a potential base
  • I set my entry to 2 cents above the yellow line and it was filled during the 14:35 bar
  • It did went up initially but it didn't last
  • My Protective Stop was triggered during the 15:35 bar
  • Because of yesterday's 300+ points drop, I've read from a lot of blogs that most traders just stayed away today
  • Unfortunately, I was just too itching for trades

072707 - CROX - 5mins - Loss*Paper

Symbol: CROX
Type: Long
Entry: During the 12:50 bar
Exit: During the 13:00 bar
Result: Lost -0.66%

  • This is my first trade in the past 2 weeks... and I was feeling a little rusty right off the start
  • I knew CROX had a big gap up in the After-hour trading yesterday, and I immediately started monitoring CROX this morning
  • Not much patterm to be spot, not just on CROX, but on everything
  • I finally caught this hammer painted at 12:45
  • The 5eMA was too far away at that moment
  • I waited a short period before entering, during the 12:50 bar
  • My Stop wash it 10 minutes later

Tuesday, July 24, 2007

Standalone Real-time Market Indices Display

I am visiting Vancouver, Canada, this week, until Wednesday. I thought I will be able to trade in the morning, considering that I'm in the PST Time Zone, but I was wrong. All these traveling in the past 2 weeks are really emotionally and physically draining! I hoping to resume some training later this week. Until next trade, I came across the following device, and I thought my 3 readers would like to know something like this is out there in the market!

This is a display unit that uses the same wireless frequency that is used by Doctors, and such, in emergency response systems. According to the description, it displays the DOW, NASDAQ, and the S&P, in real-time, along with a button to pick one of these Indices to display its graph on the lower portion of the screen. It runs on batteries, and it has the standard 'picture frame' type of 'backing' for you to let it sit on a desk, or hang it on the wall... right across the toilet seat so that you can keep track of the market while you're dumping 'your stocks.' It also provides a magnetic 'backing' so that you can stick this thing on a frig too!

The price is $129.95 at HAMMACHER SCHLEMMER. It's a bit expensive, I think. What do you think?

Until next time... good trades!

Monday, July 16, 2007

No Trading This Week

Unfortunately, I'm on a business trip this week. Therefore, there will be no trading until the week of 7/23.

Thank you for reading my blog.

Best of trades to you!

Saturday, July 14, 2007

071307 - RSH - 15mins - Loss*Paper

Symbol: RSH
Type: Short
Entry: During the 13:30 bar
Exit: During the 14:00 bar
Result: Lost -0.13%

  • With this trade, I summed up the day with a triple defeats
  • I thought when the prices break the Opening Low / Support set forth in the previous hour, along with the falling 5eMA, I would be in good shape
  • But I was wrong!
  • The prices didn't go much further south of the Opening Low and it retraced
  • My stop was really tight for this trade so it didn't take much to get it triggered
Overall, it is a very discouraging day for me! Today is a day that I would question my ability to (learn to) trade. Can I make it? Can I even be successful in this? Can I even just break even?

:-(

071307 - AA - 15mins - Loss*Paper

Symbol: AA
Type: Long
Entry: The 10th bar
Exit: The 11th bar
Result: Lost -0.38%

  • Again, I am not too sure what went wrong here
  • I believe this setup is similar to the setup below, and my entry didn't have any spike in volume
  • Please feel free to post your observation. I do want to hear criticism from someone. I want to know/learn what went wrong

071307 - GE - 15mins - Loss*Paper

Symbol: GE
Type: Long
Entry: The 6th bar
Exit: The bottom of the 9th bar
Result: Lost -0.50%

  • I'm not too sure what went wrong with this trade
  • I thought I was seeing a base and break setup, but momentum failed
  • Looking back at the chart now... my limited knowledge tells myself that maybe the volume on the Entry Bar was not significant, and therefore, I should not have entered to begin with

Thursday, July 12, 2007

071207 - RIO - 15mins - Observation


  • I've been monitoring this all day... wondering where would my entry be?
  • There were Upper Shadows on 5mins, 10min, and 15mins during the 11:20 and 11:30 period
  • And there was no significant spike in volume during such period
  • Where would you have entered? Feel free to leave a comment!
Update:

Dave was kind enough to take the time to leave a message. He said:
I would have entered after the 11:15 candle on the 15 minute charts. A small marubozu candle on the OR high.
Since I have no idea what a Marubozu candle is, I decided to look it up:

The marubozo's defining characteristic is the absence of upper or lower shadows. On an up day the opening price is equal to the day's low, and the closing price is equal to the day's high. This type of candle suggests strongly that there is a greater demand for the stock than there is willingness for people to sell it. The opposite is true when the marubozo appears on a down day (when the opening price is equal to the high of the day).

Ah.. now that I know!

071207 - GG - 15mins - Loss*Paper


Symbol: GG
Type: Long
Entry: The end of the 6th bar
Exit: During the 8th bar
Result: Lost -0.08%

  • I saw the Hammer painted at the 10:30 bar, but the volume was not that convincing
  • I waited to see how the next bar will turn out... and it turned out a strong bar that closed above its Opening Range High
  • I entered towards the end of the 10:45 bar
  • I had to step away from my desk for a quick meeting, and when I returned, I was looking at the 11:30 bar, under the 15min frame
  • I switched over to the 5mins chart and noticed the Shooting Star shining right at my face, along with a bearish engulfing pattern right after.
  • I just decided to exit the trade with a $0.02 loss.

Monday, July 9, 2007

070907 - PLCE - 10mins - Gain*Paper


Symbol: PLCE
Type: Short
Entry: During the 12:50 bar
Exit: During the final bar
Result: Gained +1.34%

  • (PLCE) gapped down, retraced back to the 61% Fib., and started to head south back to the Opening Low
  • Looking back, I wonder if the beginning of the 11:50 bar would make sense. It is certainly more profitable
  • My entry was based on the 12:30 and 12:40 bars both painted Upper Shadow, along with the lowering 5eMA
  • Although not important now, I question my Protective Stop... set to above the 12:20 bar
  • It took forever for the prices to head south
  • When it did, it failed to reach my next Fib. target
  • But it was still a nice 1.3% gain
  • The first 2 charts were captured at entry time. I want to use them as a reference

Saturday, July 7, 2007

070607 - BOT - 10mins - Observation


  • Here's another setup that I was monitoring this morning but missed the entry
  • (BOT) gapped up this morning and retraced a bit back to the 80% Fib., but later got pushed back, forming almost a Hammer-type bar
  • As soon as the prices met the rising 5eMA, it was supported nicely
  • It was 10:40 that I last look at (BOT), and I had to step away for a quick meeting
  • When I came back to my desk, the prices was almost at 119% Fib.!
  • I continued to monitor the stock throughout the day, and I only wish that I had enter this trade, rather than the (IBKR) trade
  • Did any of my Readers catch this one?

070607 - IBKR - 10mins - Loss*Paper


Symbol: IBKR
Type: Short
Entry: During the 11:50 bar
Exit: During the 12:10 bar
Result: Lost -0.52%
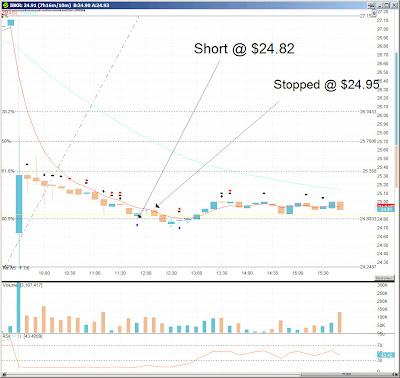
  • (IBKR) gapped-down at the open and retraced back to the 50% Fib. Level
  • Prices consolidated a bit towards the lowering 5eMA
  • I drew yellow-line to indicate a potentail base, and I set my entry to 2 cents under the base
  • But my dilemma with this approach was that the 5eMA, during the eventual entry, was still rather far away
  • Therefore I wasn't really sure if I'm doing the right thing here
  • As you can see, the prices did rise back towards to the 5eMA at noon, and the next bar (12:10) took out my Protective Cover, before the prices fell (just slightly) further
  • Anyway, my target was the opening low, which as you can see here, it was not even close
  • Either way, I would not have made much from this trade
**What interesting was that, as soon as I entered the trade, I had to step away from my desk. It was another 20 minutes or so later that I returned, and I was trying figure out if the 12:10 bar hit my Protective Cover. The line that I drew on Quote Tracker told me that the 12:10's bar High was at $24.9499. However, when I checked the price from eTrade, the 12:10 bar High was $25.00! I checked again on MarketWatch.com and it showed $25.00 as well!

On my God! The feed that I'm receiving from QT was inaccurate!

I'm on paper right now. But once I'm on real-money, I need to re-consider what feed do I use for QT. Currently, the feed is provided by Ameritrade. I have an account with them, but with no money in the account. (Somehow they didn't close my account.) Therefore, I feel comfortable providing the User Name and Password to QT when I was first trying-out the software.

Do my readers, if you have time, see the 12:10 bar High at $25.00?

Do you have any recommendation to my QT/Ameritrade experience that I had today?

Thanks!

Friday, July 6, 2007

070507 - NTES - 10mins - Loss*Paper


Symbol: NTES
Type: Long
Entry: During the 12:00 bar
Exit: During the 12:00 bar
Result: Lost -0.21%

  • (NTES) gapped up today, and the prices when above the Opening Range High briefly, before retracing back towards the 5eMA
  • It painted 2 consecutive hammer-type candles at around 11am, and I thought about entering but the eMA was rather far away
  • The prices went up a bit during the 11:00 hour, and the 5eMA was closing in
  • During the 11:40 and 11:50 candles, there was an unusual spike in volume, and my take was that it was signaling an upcoming move
  • I set my entry to 2-cents above the Highs of the 11:00 hour, and my Entry was triggered at around noon
  • Sadly, within minutes, the prices also fell through my Protective Stop

Wednesday, July 4, 2007

200706 - Month-end Review

After a very slow month of May (in terms of my own trading opportunities) because of those stupid weeks-long meetings at work, I hurried to get back into action during the month of June.

11 Wins & 28 Losses
I executed a total of 39 trades during the month of June. With 28 Losses, my winning percentage for the month was a mere 28.21%. Compared to my 33% win-rate in May, and a 62% win-rate in April, my performance is certainly going downhill.

Fortunately, Trader Jamie, from Wall St. Warrior, provided a lot of advices towards the last 2 weeks of the month, which had helped me to at least learn what I am doing wrong. Just look at the long Lower Shadow from the graph above!

Overall, I suffered a -1.54% lost from my bankroll, that started with $40k (Paper!) However, I feel that the amount of knowledge that I've gained in this past month is worth a whole lot more than the -1.54% Paper-loss! I absolutely look forward to another month of trading.

The Graph
Just for fun, I decided to add a few columns into my Excel Spreadsheet and turn my Profit/Loss into a Candlestick chart. I thought my 3 Readers of this blog might have a laugh about it. I tried, but couldn't find a way to incorporate a Moving Average on top of the Candlestick, in Excel. I guess Excel just doesn't provide such advance graphing feature. Unless something drastic happens, I should continue to update my chart on a monthly basis... during the Month-end Review. I hope you all like it!

Until next post, best wishes to you!

Monday, July 2, 2007

I will resume trading on July 5.

I just have too many meetings this morning! I thought most people at work are taking today and tomorrow off. But it doesn't appear to be the case.

I am still working on my Month End report. I will post it as soon as possible.

Until next time, good luck with your tradings.