Where was this program this time last year? Now Howard Lindzon and the StockTwits team need to come up with something like this for its Users!
Thursday, September 17, 2009
The PUMA Index
Filed Under ~ Video
Tuesday, September 8, 2009
Monday, April 13, 2009
Swing Trade - Positioned - TDS
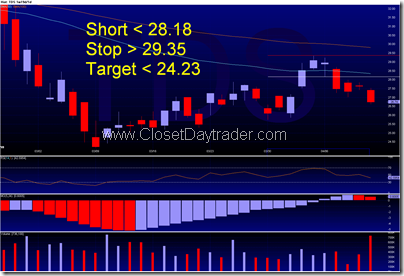
Here’s a trade on TDS that I took position last week. Things are looking good and I have just adjusted my Stop to $28.15 (Break-even). It’s no longer at $29.35 anymore!
Filed Under ~ Swing Trades
Daytrade – Result – Win – INTU
My second trade of the day. What I saw…
- 2 consecutive inside bars and NR7 combination
- A downward pressing 5ema
- No Entry Bar
- It’s obvious that I was trying to force a trade here
- My Entry was under the white line below the low of the 2 combo bars
- My Target was the Opening Low
- My Short was triggered by the 8th bar
- I thought I was Stopped Out when prices retraced back above my Stop, but it didn’t happen (see white circle on chart)
- The long upper shadow on the 9th bar was caused by bad data
- Another entry point could be the break of the 11th bar bottom
- My Target was reached during the 12:30 bar
Filed Under ~ Daytrading, Gains*Paper, Paper Trading
Daytrade – Result – Loss - STX
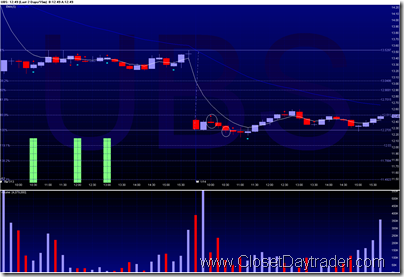
It’s been a long while since I last day-traded, and I’m thrilled to be participating this morning. My first trade was STX. What I saw was…
- 2 consecutive combo’s of Inside Bar + NR7
- Although the 2 inside bars did not signal an entry for me, I decided to gamble and hope that prices will reach its Opening Low, for a small gain
- Set Entry just below the Low of the 2 Inside Bars (see white line)
- Stop was above the Red Bar
- My Entry was triggered by the following bar (see 2nd chart)
- Unfortunately, I was stopped out 15 minutes or so later during the next bar
Filed Under ~ Daytrading, Losses*Paper
Sunday, April 12, 2009
Long Term Trade - FXE
- Here’s another Long Term trade that I took position from last week
- Please note that if my Target of $124 is reached, I intend to stay in position and evaluate the situation
- Looking at this chart over the weekend, I noticed that the Target does not yield a full 2R return
- The 2R minimum return is the new standard of all my entries from now on
Filed Under ~ Long-Term Trades
Thursday, April 9, 2009
Swing Trade – Positioned – TDS
- Here’s a Short position that I’ve taken a few days ago that was able to weather the rally-storm today
- Let’s hope that I can hit my Target on this one so that I can recover some of my losses from today
Filed Under ~ Swing Trades
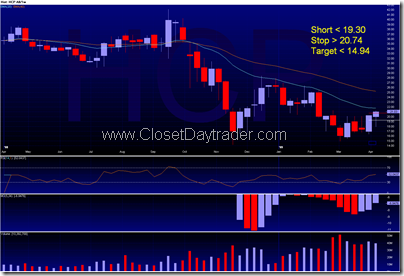
Swing Trade – Result – Loss – HCP
- HCP looked a bit promising for about 2 days.
- When I saw that red Doji yesterday, I was already a bit concern
- I didn’t expect it to rally so strong!
Filed Under ~ Losses, Swing Trades
Swing Trade – Result – Loss – AIV
- I was hoping for a quick Swing Trade of AIV
- I entered Short when prices fell below $6.11
- Looking back at my setup now, I think I was a bit optimistic. $5.00 mark should be my Target instead of the mid-$4 range.
- It never got there anyway
Filed Under ~ Losses, Swing Trades
Monday, April 6, 2009
More Reference on Shorting GLD
Kevin posted his analysis on why he is bearish on GLD and his post can be found here. Meanwhile, my setup for trading/shorting GLD is posted here from earlier today.
Filed Under ~ ETFs, Long-Term Trades
Weekend Links – Non-Trading Related
On-line education anyone?
When in doubt, pick ‘C’!
100% Home Grown Ignorant.
Did the US participate in Earth Hour?
Twitoria – How many Twitter Friends are you really following?
How to add Windows Live Messenger to your website
BMW’s April Fool’s Jokes Collection
The drying reservoir (via Maoxian)
Long Term Trade – Setup - GLD
- GLD is looking to test the 40EMA Support Level
- Instead of using the 40EMA as Entry, I picked a round-number of $84.00 instead.
- Protective Stop is another round-number of $88.00
- Target is $72.00 and below.
Filed Under ~ ETFs, Long-Term Trades, Setup
Long Term Trade – Setup - EFA
- Trying to catch a reversal on this setup
- The trigger point is above the white line
- Target is where the blue rectangle is with the bottom of the rectangle sitting at 2R
- The Protective Stop is just under $31.55
Let’s see if this setup will get triggered!
Filed Under ~ Long-Term Trades, Setup
Wednesday, April 1, 2009
Long Term Trade - XHB
I entered long on XHB on Monday. My Stop was set to just above the high point of last week. Let’s see if this trade will work out.
Filed Under ~ Long-Term Trades
Saturday, March 28, 2009
Laying low… to avoid lay-offs
Folks, I haven’t been trading (from work) lately because rumors are flying everywhere that the senior management is planning for some work-force reduction… a fancy term of the big “L” word known as lay-offs!
In addition, the management is trying to find every possible way to get rid people! Just the other day, someone from Marketing was ‘let-go’ because he was caught using bit-torrent software from his PERSONAL lap-top through the company’s network!
The last thing I want is to have someone caught me trading from work! As my Readers well know, my trading is not good enough to be profitable, not to mention sustaining a living.
Everyone is guessing that the ‘pink slips’ will be handed down in the next week or so. I will try to post some updates here whenever I could, when I’m NOT at work.
Best of luck to me! :-|
Filed Under ~ Misc.
Weekend Links – Non-Trading Related
A site that tracks your hotel price
A very cool Nikon commercial
I didn’t know there’s such a thing as fake eggs
The to-do list for the unemployed
Google Chrome is too difficult to hack
The AIG “I quit'” letter
Everyone should cut down on salt intake
Madoff’s hourly rate
Should you trust Google Products?
How to embed Google Reader from within Outlook
A flying helicopter hotel that doesn’t even look real to me.
Filed Under ~ Links
Sunday, March 15, 2009
Weekend Links – Non-Trading Related
- Only in Saudi Arabia. Is it because the roads are so sandy all the time?
- How to climb up a cross… naked.
- Maybe someone should hire his wife instead.
- F U! per Mickey Mouse’s Chief.
- How to send and receive Hotmail from your GMail Account.
- Hudson River Landing CGI mixed with radio tower conversation.
- A bottle of Perrier-Jouët Vintage 1825.
- Looking for a brand new BMW M5 or M6?
- A cool Twitter Plug-in for Windows Live Writer.
Tuesday, February 24, 2009
Chart of Interest - IEF
What do I see?
- Resistance become Support at $92.75-ish level (see white line.)
- A higher Support was formed at $93, which happens to be the 50% Fib. from June low to December high
Action Item(s)?
- None at the moment
- But may consider Long using $93 as Support
Filed Under ~ ETFs, Long-Term Trades
Saturday, February 21, 2009
I Need to Mix Things Up
Things have changed!
Since I have (sort of) started trading again, I have noticed that my work-load at work is no longer the same as I used to when I first started this blog. It is getting increasingly difficult to find time to daytrade while at work. My responsibility at work has increased tremendously, and it translates to more meetings, emails, and administrative stuff. Although my company has just announced a plan to layoff some of its workforce. If I can avoid the layoff, it only means I will have even more work. And if I’m PART of the layoff, I guess I will have more time doing daytrading! For now, I have to be optimistic and assume that I will survive the layoff. Therefore, I need to re-strategize my trading.
No, I’m not quitting daytrading!
Instead, I have decided to mix things up a bit. Instead of solely focus on daytrading, I’m going to mix up my strategy with some swing trading and some long-term trading. I will still be involve in daytrading whenever I could. After all, I still see it as an unaccomplished task of mine. But should you find some longer term charts on my blog, I want to officially disclaim the reason here/now.
For now, I have decided NOT to change the name of my blog, nor my alias.
Until next time, Happy Trading!
Filed Under ~ Misc.
Wednesday, February 11, 2009
Monday, February 9, 2009
Chart of Interest – XLK
What do I see?
- I don’t see much except that prices broke $16.49 Resistant
Action Item(s)?
- None at this moment / Monitor for Long
Filed Under ~ Long-Term Trades
Chart of Interest - XLE
What do I see?
- Pivot Point / Resistance at $53.28
- I don’t see an Entry at the moment
Action Items?
- None at this stage
- Looking for a Long entry
Filed Under ~ Long-Term Trades, Observation
Chart of Interest - SMH
What I see?
- A Cup and Handle formation
- Pivot Points at $19.16 level
- Gap-Resistance at $23.00, which could also be an even number resistance as well
- Possible Long entry if prices close above the $19.16 level
- However, R factor is not favorable if the Stop is set to $16.00
Action Item(s)?
- None for now
Filed Under ~ Long-Term Trades, Observation
Wednesday, January 14, 2009
Observations: ADM, BG, ERIC, TIF, and UBS.
I tried, and wanted, to make a trade today, but I just couldn’t spot any Entries! Here are a few charts that I was looking at this morning.
- It was a NR7 + Inside Bar + (almost) Hammer, and I wanted to go Long had prices broke through the previous bar high
- My Target would be merely the next Fib Level
- It would still put me at 2R profit, had it worked out the way I wanted it to
- It didn’t, and you are looking at the reason why it didn’t
- Fortunately, I didn’t jumped the gun
- With BG, I was hoping that the lowering 5eMA would act as Resistance and push the prices back to the Day-Low
- The Entry Bar was the Inverted Hammer (see circled), and my Entry was set to the Previous Bar low
- I thought with the market in such a Bearish mode, it’s easy to drop back down.
- It didn’t, and my trade didn’t get triggered
- I’m certainly ‘okay’ with it looking at the chart now
- I was hoping for a Base and Break and it never happened
- Once again, I was proud of myself for sticking to my entry rules, and never dive-in ahead of time in anticipation of what *could* happen
- In this case, nothing!
- With TIF, I was almost certain that Yesterday’s Low would act as Resistance and push the prices back towards its Day Low
- Too much wishful thinking there!
- It looks like Yesterday’s Low was blown away just like that!
- As for UBS above, I saw the 3rd Bar Inverted Hammer, but I just couldn’t see an entry in the shorter time-frame
- As prices fell pass the Opening Low, I thought I’ve missed the entry (as mentioned in Twitter.)
- It turned out that this is another ‘Good Miss!’
Overall, I’m proud of myself for sticking to my rules, and not “early-entry” into these positions. But “not trading” means “no money.” I need my trades to be more frequent, and more accurate.
Filed Under ~ Observation, Paper Trading
Tuesday, January 13, 2009
LVS – A Slight Win
- An unconvincing Base and Break trade
- Unconvincing because I really didn’t see any entry bar signaling an Entry
- Instead, I just took the Opening Range Low (15mins) as the Base/Pivot Point, and entered Short when prices dropped below that level
- Once I was committed to this trade, I adjusted the Stop continuously to a level that makes sense
- I was then Stopped Out at $6.12
- Prices did eventually hit my Target of 138%Fib
Filed Under ~ Base and Break, Fibonacci Retracement, Gains*Paper, Paper Trading
TCK - My First Lost in 2009
- I tried to chase this trade!
- I didn’t really see an entry signal, and I still chose to enter Short when the prices dropped below the Open/Day Low.
- My Target was the 138%Fib., and it never even reached 119%
- It hit my Protective Stop eventually, and the prices never reached a low again
Filed Under ~ Losses*Paper, Paper Trading
Wednesday, January 7, 2009
DRYS – There Were Plenty Left On The Table!
As mentioned in yesterday’s post, I was expecting DRYS to pull back to the next Fib. Level, before continuing its rise.
With such belief in mind, the first stock that I pulled up today was DRYS, especially when the market is in such Bearish mood today.
DRYS Gapped Down first thing in the morning and slowly reclaimed its lost ground, all the way beyond Yesterday’s Low.
From the Chart below, you can see that the 2nd Bar almost formed an Inverted Hammer. As the 3rd Bar was forming, I zoomed-out the Chart to 3 Days Interval and noticed that the potential Support Line can be drawn from Monday’s Day-High. And since the prices have yet to close ‘above’ the 5eMA, I decided to enter Short when prices broke the low of the 3rd bar, with my Protective Stop set at the top of the 3rd bar, hoping that the ‘u-turning’ 5eMA will act as my Resistance.
Unfortunately, the Upper Shadow of the 4th Bar surpassed by Protective Stop by just that bit (see below), and forced me to exit my entire position, automatically of course.
With all those self-belief in me, I decided to re-enter the trade, this time when the prices broke the Low of the 4th bar (Remarks: I’ve switched from 15mins to 10 mins chart by now.) This time, I tried to be more cautious and set my Protective Stop just right above the 5th bar high (meaning less R for the run.)
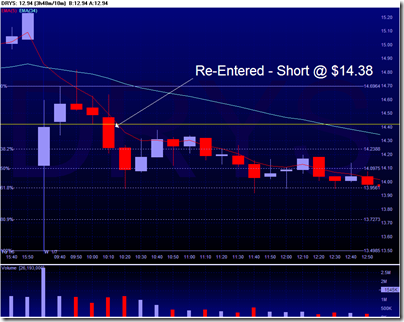
By now, I was trying to plot out the potential Support Levels for my exit, if necessary. The Opening Bar’s range was so wide that I did have some doubts that it might not hit its Day-Low, today.
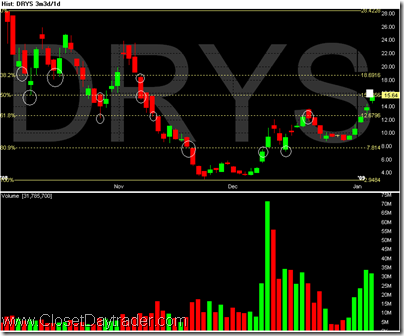
I pulled the Fib from Day-High to Day-Low, and the most obvious Pilot Point was at the 80%Fib. Level. And obviously, and again, at Day-Low. (See circles in the Chart below.)
Although I did adjust my Protective Stop, I didn’t follow it too closely by changing the Stop to previous bar’s High. If so, the very few Up-bar (Blue) that you see below might have exited my position. Which prompts me to think… I need to really learn how to master the skills of determining my Protective Stops.
Unfortunately, I had to leave for a meeting, and I was forced to exit the trade right before 1400hrs. Otherwise, I would have caught on to a very nice run. Prices didn’t stop until hitting the 161%Fib!

Filed Under ~ Fibonacci Retracement, gain, Gains*Paper, Paper Trading
Range Contraction – by Wall St. Warrior
I just learned something new! It’s called Range Contraction, and I read all about it from Trader Jamie’s blog.
Filed Under ~ Range Contraction
Tuesday, January 6, 2009
Fibonacci Points: DRYS
DRYS has been on my radar in the past few days and this evening, I took some time to study DRYS on a longer time-frame chart. (Part of my New Year Resolution!)
I’ve circled all the points that DRYS reacted to the major Fibonacci Retracement points, and not surprisingly, today’s closing price is exactly at the 50% Fib. Retracement from October High to December Low.
My prediction is that the prices of DRYS will retrace back a bit to the $12.60-ish level, before continuing its upward clime again.
Let’s see how it will turn out. Meanwhile, chime in if you have some feedback to share!
Filed Under ~ Fibonacci Retracement, Forecastings, Swing Trades
Observations: MS, TCK, and BBY
I was in the market today but couldn’t find any trade to execute. I just want to post a few charts to document my thought/selection process on a few set-ups that I thought about going-in, but chose not to. Almost all of them didn’t work out the way I wanted to, so I guess it must be a good thing.
1) I thought about enter long off of the 4 bar hammer-like high, but the upper shadow of the first 3 bars stopped me from doing so. If entered, I would have got stopped-out for a break-even, if not a small lost when prices retraced back to the Opening High. It now looks like the Opening High could be a Pivot Point. As you can see, prices did reach the 138Fib.
2) Next one is TCK. I put significant amount of time debating if I want to move-in with a Long, as prices broke the hammer-like high on the 6th bar on the 3-minute chart.
It still looked somewhat convincing when I flipped over to the 5-minute chart… a Long entry above the high of the 4th bar
But neither the 10, nor the 15 minute chart showed convincing entry point. (See the next 2 charts below.) Therefore, I gave up the move, and as it turned out, it was an excellent decision.
The last one is BBY. Looking the chart now, I don’t even know what I was looking at this chart. I don’t even know what to comment here! (Should I just remove this chart?)
No trades is still better than a losing trade. That’s is what I’ve been telling myself, and I need to add this ‘no-trade’ concept onto my New Year Resolution!
Filed Under ~ Observation
Monday, January 5, 2009
First Trade of 2009 - TBT
- I thought I was looking at a ‘Cup and Handle’ setup, but soon after I entered the trade, I doubted myself
- Not until I have entered the trade, I noticed that there were already 2 waves to long-solid up bar (see chart below)
- And I was already prepared for an exit after the 3rd wave
- Since the entry wasn’t ideal, I was particularly cautious
- The down bar that you see below actually went all the below my entry-line

- But as you can see below, prices did go above and beyond my target, of 138% Fib.

- The good news is, this little trade still earned me a bit over 2R
- I’m happy to start the New Year with 2R!
Filed Under ~ Gains*Paper, Paper Trading
Saturday, January 3, 2009
2009 New Year Resolution
This list is what I’ve came up with in the past few days. I’m hoping this list will help me to be a better Trader in 2009. This list is subject to updates, and I’ll elaborate a bit more on each item as time permits. Meanwhile, if you have comments or suggestions, please feel free to drop me a note.
- Increase the number of ‘Trading Days’
- Be more selective with my Executions
- Diversify my trading strategies
- Maintain a trading journal/spreadsheet, in addition to this blog
- Improve communications/networking among Traders/Bloggers
- Begin real-money trading by year-end
- Read-up on my trading books
Filed Under ~ Resolution
(DRYS) - Observation
(I’m having some issues with my charting software this weekend, so please excuse these 2 temporary charts copied from MarketWatch.)
I tried to trade today but I have to admit that I’m still feeling very rusty with everything. I was only able to picked out (DRYS), while everything else seemed to me that they are ‘un-fit’ to be traded.
I almost pulled the trigger shortly before 11am. Although it turned out to be the correct decision, I actually thought that I missed a great run. For the record, the reason why I didn’t pull the trigger was because of all those Upper Shadows formed in every single bar since opening. I interpreted that as resistance-aplenty lying around the Opening High. The second reason why I didn’t pull the trigger is because there weren’t really an Entry Bar at all! Technically, speaking, I shouldn’t even be posting this charts because this set-up is just one of the many that I discarded yesterday morning. But since I want to post something to start-off the year, hence came (DRYS).
The question that pondered me afterwards, was that even though it didn’t hit my 138Fib level, shouldn’t I still somehow find a way to ride that small wave up? If yes, then how?
Anyway, I’m just happy that I started trading again.
Once again, Happy New Year to all my readers!
Filed Under ~ Observation
Thursday, January 1, 2009
Happy New Year!
Wishing all my Readers a wonderful New Year!
Thank you for your continuous support!
Filed Under ~ Misc.


