Showing posts with label Observation. Show all posts

Monday, February 9, 2009

Chart of Interest - XLE

XLE - 2009-02-08 231001 - 1d

XLE - 2009-02-08 231211 - 1d

What do I see?

  • Pivot Point / Resistance at $53.28
  • I don’t see an Entry at the moment

Action Items?

  • None at this stage
  • Looking for a Long entry

Chart of Interest - SMH

SMH - 2009-02-08 225533 - 1d

SMH - 2009-02-08 230050 - 1d

What I see?

  • A Cup and Handle formation
  • Pivot Points at $19.16 level
  • Gap-Resistance at $23.00, which could also be an even number resistance as well
  • Possible Long entry if prices close above the $19.16 level
  • However, R factor is not favorable if the Stop is set to $16.00

Action Item(s)?

  • None for now

Wednesday, January 14, 2009

Observations: ADM, BG, ERIC, TIF, and UBS.

I tried, and wanted, to make a trade today, but I just couldn’t spot any Entries!  Here are a few charts that I was looking at this morning.

ADM - 2009-01-14 165514 - 10m

  • It was a NR7 + Inside Bar + (almost) Hammer, and I wanted to go Long had prices broke through the previous bar high
  • My Target would be merely the next Fib Level
  • It would still put me at 2R profit, had it worked out the way I wanted it to
  • It didn’t, and you are looking at the reason why it didn’t
  • Fortunately, I didn’t jumped the gun

BG - 2009-01-14 165648 - 15m

  • With BG, I was hoping that the lowering 5eMA would act as Resistance and push the prices back to the Day-Low
  • The Entry Bar was the Inverted Hammer (see circled), and my Entry was set to the Previous Bar low
  • I thought with the market in such a Bearish mode, it’s easy to drop back down.
  • It didn’t, and my trade didn’t get triggered
  • I’m certainly ‘okay’ with it looking at the chart now

ERIC - 2009-01-14 165354 - 10m

  • I was hoping for a Base and Break and it never happened
  • Once again, I was proud of myself for sticking to my entry rules, and never dive-in ahead of time in anticipation of what *could* happen
  • In this case, nothing!

TIF - 2009-01-14 165856 - 15m

  • With TIF, I was almost certain that Yesterday’s Low would act as Resistance and push the prices back towards its Day Low
  • Too much wishful thinking there!
  • It looks like Yesterday’s Low was blown away just like that!

UBS - 2009-01-14 165615 - 15m

  • As for UBS above, I saw the 3rd Bar Inverted Hammer, but I just couldn’t see an entry in the shorter time-frame
  • As prices fell pass the Opening Low, I thought I’ve missed the entry (as mentioned in Twitter.)
  • It turned out that this is another ‘Good Miss!’

Overall, I’m proud of myself for sticking to my rules, and not “early-entry” into these positions.  But “not trading” means “no money.”  I need my trades to be more frequent, and more accurate.

Tuesday, January 6, 2009

Observations: MS, TCK, and BBY

I was in the market today but couldn’t find any trade to execute.  I just want to post a few charts to document my thought/selection process on a few set-ups that I thought about going-in, but chose not to.  Almost all of them didn’t work out the way I wanted to, so I guess it must be a good thing.

1)  I thought about enter long off of the 4 bar hammer-like high, but the upper shadow of the first 3 bars stopped me from doing so.  If entered, I would have got stopped-out for a break-even, if not a small lost when prices retraced back to the Opening High.  It now looks like the Opening High could be a Pivot Point.  As you can see, prices did reach the 138Fib.

MS - 2009-01-06 152304 - 15m

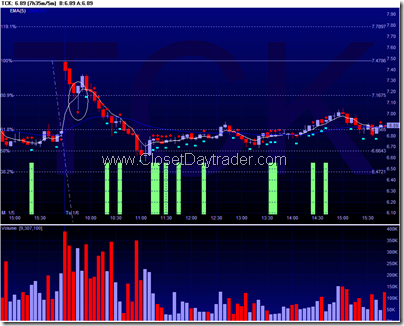
2) Next one is TCK.  I put significant amount of time debating if I want to move-in with a Long, as prices broke the hammer-like high on the 6th bar on the 3-minute chart.

TCK - 2009-01-06 151705 - 3m 

It still looked somewhat convincing when I flipped over to the 5-minute chart… a Long entry above the high of the 4th bar
TCK - 2009-01-06 151711 - 5m 

But neither the 10, nor the 15 minute chart showed convincing entry point.  (See the next 2 charts below.)  Therefore, I gave up the move, and as it turned out, it was an excellent decision.

TCK - 2009-01-06 151931 - 10m TCK - 2009-01-06 151936 - 15m

The last one is BBY.  Looking the chart now, I don’t even know what I was looking at this chart.  I don’t even know what to comment here!  (Should I just remove this chart?)

BBY - 2009-01-06 152122 - 15m

No trades is still better than a losing trade.  That’s is what I’ve been telling myself, and I need to add this ‘no-trade’ concept onto my New Year Resolution!

Saturday, January 3, 2009

(DRYS) - Observation

2009-01-02_DRYS_15mins 2009-01-02_DRYS_5mins

(I’m having some issues with my charting software this weekend, so please excuse these 2 temporary charts copied from MarketWatch.)

I tried to trade today but I have to admit that I’m still feeling very rusty with everything.  I was only able to picked out (DRYS), while everything else seemed to me that they are ‘un-fit’ to be traded. 

I almost pulled the trigger shortly before 11am.  Although it turned out to be the correct decision, I actually thought that I missed a great run.  For the record, the reason why I didn’t pull the trigger was because of all those Upper Shadows formed in every single bar since opening.  I interpreted that as resistance-aplenty lying around the Opening High.  The second reason why I didn’t pull the trigger is because there weren’t really an Entry Bar at all!  Technically, speaking, I shouldn’t even be posting this charts because this set-up is just one of the many that I discarded yesterday morning.  But since I want to post something to start-off the year, hence came (DRYS).

The question that pondered me afterwards, was that even though it didn’t hit my 138Fib level, shouldn’t I still somehow find a way to ride that small wave up?  If yes, then how?

Anyway, I’m just happy that I started trading again. 

Once again, Happy New Year to all my readers!

Thursday, January 31, 2008

013108 - CNQR - 15mins - Observation

Symbol: CNQR

  • Here is another trade that I would have taken had I been watching it unfold
  • CNQR gapped up during opening, painted a very strong bar
  • It followed by 2 consecutive Inside Bars. A weak bar followed by a stronger bar
  • The 4th bar was a Hammer-wanna-be. The Upper Shadow was actually too long to be considered a Hammer
  • And looking at it again now, I also noticed that the 4th bar also failed to closed above the Opening High. Something that I missed during real-time.
  • But at that moment, had I been watching it unfold in real-time, my entry would have been the 4th bar, when it crossed the Opening High
  • I would have Stopped Out by the 8th bar, and the prices did seem to have gain enough strength to go any further

013108 - HRS - 15mins - Observatoin


Symbol: HRS


  • It was already more than an hour into trading before I came across HRS

  • It was clear to me that a resistance level has formed slight above the Opening Range High

  • A review of the Daily chart shows that a Pivot Point / Resistance level has formed (at the yellow line on both charts.)

  • I set a Price Alert a tick below the yellow line, thinking that I would enter Long when prices cross the Pivot Point

  • I don't know why, but I missed the Alert when it happened!

  • When I've found out the prices have crossed the line, it was already in the red bar coming back down

  • I seriously thought about entering Long, but decided against it

  • The thing is, had I been watching the market more closely, I knew I would have entered this trade, which would result in another losing trade

  • I'm still debating if I should record this trade into my spreadsheet as if I really did executed this trade. Because I knew I would, had I was watching it as it happened

  • HRS is now also on my Watch List. Let's see how it works out tomorrow

013108 - JBHT - 15mins - Observation


Symbol: JBHT

  • Remember my failed trade from yesterday on JBHT?
  • For what reasons? I don't know! But I decided to revisit JBHT, not for potential trades, but to just see if there were any opportunities
  • The first chart shows how JBHT performed today, along with notation of my entry and exit from yesterday
  • As you can see, JBHT totally surpassed yesterday's performance and moved on to (almost) reaching my yesterday's target of 138% Fib (from day-before/yesterday)
  • The second chart is a Daily Chart (kind of) showing why JBHT resisted at where it resisted today. Sort of like a Pivot Point.
  • In fact, today's performance on the Daily Chart painted a very nice Bullish Engulfing bar. A very strong bull signal, if confirmed its run tomorrow.
  • I have added JBHT to the watchlist that I have just started building. (Something that I want to start doing for 2008.)
  • Please! Please feel free to comment on your observation. I would like to hear your opinion.

Wednesday, January 23, 2008

012308 - PALM - 15mins - Observation


Symbol: PALM
Type: Short
  • First, 'No', I didn't trade today! The only thing that I traded was a few shares of dirty diapers during Pre-opening hours!
  • I'm assuming that there were tons of gappers this morning. I was just browsing different stocks to see their damages and I came across this one, PALM.
  • It seems to be dummy setup with 2 consecutive Inside Bars + NR7 combo, formed right around the base.
  • I would place my Protective Stop at the 5eMA level, since the prices never closed above it prior the entry point.
  • Should be at least 5R profit. I just don't know if there were shares available to Short. (If you do know, please kindly leave a comment, just so I know.)
  • I hope my readers caught this one, or the many other opportunities out there today.

Good Trades to You!

Friday, January 18, 2008

011808 - XLNX - 15mins - Observation

It is getting extremely challenging to even monitor the market, let alone paper trading these days. I don't want to bore my readers with (first-time) parenthood stuff, but taking care of an infant is no easy task! Yes, I'm supposed to be practising my trading, secretly, while I'm at work. But when I cannot even make it to work on-time, because of late-night baby/daddy duties, it makes it extra tough for me to watch the market while I have to catch up on my work stuff! To make things worse, I have been slammed with a very big project that even if I don't have a baby, or trading, I would still have to put in 50+ hours per week of work time! Now factor my lack of sleep every night... well, you get the idea!

Anyway, I did manage to watch some charts for 2 days from last week, and 3 days this week. Amongst these few days, I didn't really spot any setups... mostly because of my rusty skills and observation from lack of practises in the past few months.

Today, I ALMOST entered long on the following XLNX trade, but just like I mentioned, I was very rusty...


Symbol: XLNX
Type: Long

  • I missed the first entry where the blue arrow. By the time I got to work, and started everything, I think was already 6 or 7 bars deep.
  • A potential 2nd entry was at the white arrow. That is also the spot where I was considering a Long entry
  • I didn't because I was just starring at the chart... wondering... and wondering.. and watching the prices blew right by me
  • Anyway, had I entered Long, I would have Stop-out during the next red bar

Well, at least I got something started. The next few months are going to tough. There are even a few business trips lined up. So my posting will be light. Please bare with me. I'm not giving up because I am still very much interested in this! The fact that I've been paper trading for this long, should show you that my interest is for real. Thanks for hanging in there, and thanks for reading my blog!

Friday, October 19, 2007

101907 - CYBS - 5mins - Observation


  • This was the first stock that caught my attention this morning.
  • But I noticed the 5eMA was too far away
  • I decided against going Long
  • Just like what Buzz Lightyear would say: "To Infinity and Beyond!"
  • And this is happening on a -366 points drop on Dow!


Tuesday, September 11, 2007

091107 - MCD - Observation

  • My final post of the day is an observation that I did on MCD
  • The chart above showed my 'would-have' entry point
  • There it was an Hammer formed right underneath the Opening High
  • But I looked at the volume, and noticed that there weren't significant spike
  • I flipped over to the 15 minute chart (see bottom chart), and noticed that the 5eMA was way too far away
  • Although I told myself that this looks really good as a Base and Break setup... I decided against a Long entry

  • It turned out to be another good run as you can see from the chart above. Ouch!
  • The chart below is the 15 minute chart that I mentioned
  • Noticed how far away is that 5eMA?
  • What do you think? Would you have entered? If so, why? Or why not?


Friday, September 7, 2007

090707 - DELL - Observation


  • Above is DELL that I observed today
  • I spotted the Inverted Hammer first on the 5min chart
  • I was too sure if it was an entry signal because when I flipped over to the 10mins and 15mins, the signals (if there were any), were not that convincing. (I always tried to get entry confirmation from 2 other timeframes charts.)
  • As I watched DELL continued its downward movement, I thought about an entry when prices broke the Opening Low.
  • Again, I chose not to enter mainly because the 5eMA seemed a bit too far away
  • It was history from that point on
  • It just kept falling


Tuesday, September 4, 2007

090407 - HOKU - Observation


  • I made 1 trade today, but the entry was so poor that I am embarrassed to post it on my blog
  • Basically, the 5eMA was a mile away when I entered... although I didn't get stopped out, I exited the trade shortly after when the prices were just flat with no volume
  • The chart above is HOKU
  • I thought about entering Long when the prices went above the OR high
  • But I was worried that HOKU might be running out of steam because of the lack-of volume
  • I decided against an entry and this is how it turned out
  • I'm sure that there are many traders out there who made some really nice moves today. AAPL and YHOO both rallied nicely
  • I look forward to checking their blogs!
  • Have a wonderful day and a successful September!

Wednesday, August 15, 2007

081507 - ASML - Observation


  • This is just a 'after-the-fact' type of observation
  • I doubt that I will be making an entry because of the previous Lower Shadows that painted between 1200hrs and 1300hrs, with some of them go as further as touching the next Fib.
  • Even with the Inverted Hammer carved at 1400hrs, there weren't any volume to support the this potential entry point
  • Still, I just want to put this chart up for future reference, and maybe my readers see some things that I didn't

Tuesday, August 14, 2007

081407 - FOSL - Observation


  • I was watching FOSL as it approached the Opening Low, and I just couldn't pick out an Entry!
  • Because I was ONLY looking at the 10mins chart!
  • Now that I have switched back to the 5mins chart, I did see a potential entry
  • But as noted on the chart, I would have stopped out almost immediately, and would have felt discouraged to re-enter the trade (5mins)
  • As for the 10mins chart, the 7th candle (inverted hammer) was tempting! It closed below the 5eMA, but failing to close below the Opening Range Low was the reason why I didn't enter the trade
  • By the time the 10th candle closed 'way' below the Opening Range Low, I thought the move was over and gave up on FOSL

Wednesday, August 8, 2007

080808 - Obersvation


  • I thought about trading FRPT but I didn't see any significant change in volume
  • By the time the 11am bar completed (with increased volume), I thought the 'move' was over, and I didn't want to chase it
  • What's your thoughts?

Thursday, July 12, 2007

071207 - RIO - 15mins - Observation


  • I've been monitoring this all day... wondering where would my entry be?
  • There were Upper Shadows on 5mins, 10min, and 15mins during the 11:20 and 11:30 period
  • And there was no significant spike in volume during such period
  • Where would you have entered? Feel free to leave a comment!
Update:

Dave was kind enough to take the time to leave a message. He said:
I would have entered after the 11:15 candle on the 15 minute charts. A small marubozu candle on the OR high.
Since I have no idea what a Marubozu candle is, I decided to look it up:

The marubozo's defining characteristic is the absence of upper or lower shadows. On an up day the opening price is equal to the day's low, and the closing price is equal to the day's high. This type of candle suggests strongly that there is a greater demand for the stock than there is willingness for people to sell it. The opposite is true when the marubozo appears on a down day (when the opening price is equal to the high of the day).
Ah.. now that I know!

Saturday, July 7, 2007

070607 - BOT - 10mins - Observation


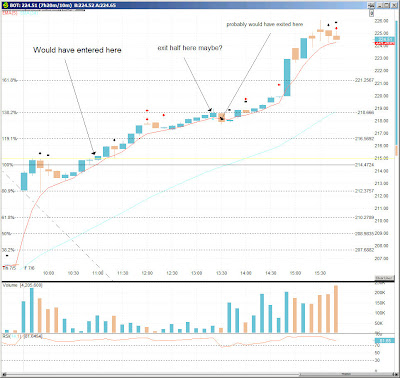
  • Here's another setup that I was monitoring this morning but missed the entry
  • (BOT) gapped up this morning and retraced a bit back to the 80% Fib., but later got pushed back, forming almost a Hammer-type bar
  • As soon as the prices met the rising 5eMA, it was supported nicely
  • It was 10:40 that I last look at (BOT), and I had to step away for a quick meeting
  • When I came back to my desk, the prices was almost at 119% Fib.!
  • I continued to monitor the stock throughout the day, and I only wish that I had enter this trade, rather than the (IBKR) trade
  • Did any of my Readers catch this one?

Thursday, June 7, 2007

060707 - MNST - 15mins - Observation


I didn't rade (MNST), but I want to create a post for my future reference. I thought about entering Short when I noticed the bearish signal that is circled. I didn't because I wasn't too sure with myself. That's why I want this post to remind myself that now (paper trading) is the time to try different things!