Showing posts with label Gains*Paper. Show all posts

Monday, April 13, 2009

Daytrade – Result – Win – INTU

INTU - 2009-04-13 140409 - 15m

My second trade of the day.  What I saw…

  • 2 consecutive inside bars and NR7 combination
  • A downward pressing 5ema
  • No Entry Bar
  • It’s obvious that I was trying to force a trade here
  • My Entry was under the white line below the low of the 2 combo bars
  • My Target was the Opening Low
  • My Short was triggered by the 8th bar
  • I thought I was Stopped Out when prices retraced back above my Stop, but it didn’t happen (see white circle on chart)
  • The long upper shadow on the 9th bar was caused by bad data
  • Another entry point could be the break of the 11th bar bottom
  • My Target was reached during the 12:30 bar

Tuesday, January 13, 2009

LVS – A Slight Win

LVS - 2009-01-13 090035 - 15m LVS - 2009-01-13 085757 - 5m

  • An unconvincing Base and Break trade
  • Unconvincing because I really didn’t see any entry bar signaling an Entry
  • Instead, I just took the Opening Range Low (15mins) as the Base/Pivot Point, and entered Short when prices dropped below that level
  • Once I was committed to this trade, I adjusted the Stop continuously to a level that makes sense
  • I was then Stopped Out at $6.12
  • Prices did eventually hit my Target of 138%Fib

Wednesday, January 7, 2009

DRYS – There Were Plenty Left On The Table!

As mentioned in yesterday’s post, I was expecting DRYS to pull back to the next Fib. Level, before continuing its rise. 

With such belief in mind, the first stock that I pulled up today was DRYS, especially when the market is in such Bearish mood today.

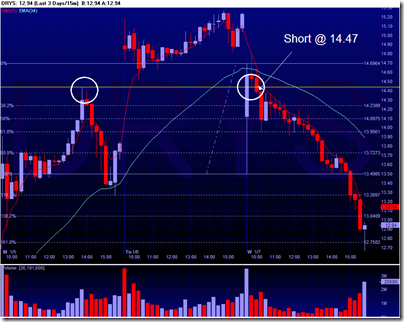
DRYS Gapped Down first thing in the morning and slowly reclaimed its lost ground, all the way beyond Yesterday’s Low.

From the Chart below, you can see that the 2nd Bar almost formed an Inverted Hammer.  As the 3rd Bar was forming, I zoomed-out the Chart to 3 Days Interval and noticed that the potential Support Line can be drawn from Monday’s Day-High.  And since the prices have yet to close ‘above’ the 5eMA, I decided to enter Short when prices broke the low of the 3rd bar, with my Protective Stop set at the top of the 3rd bar, hoping that the ‘u-turning’ 5eMA will act as my Resistance.
DRYS - 2009-01-07 134612 - 15m

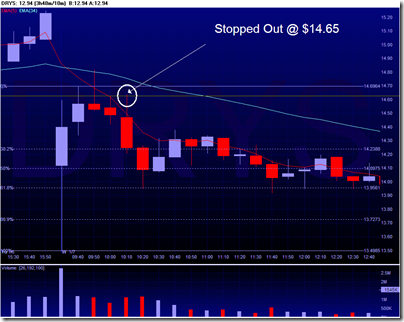
Unfortunately, the Upper Shadow of the 4th Bar surpassed by Protective Stop by just that bit (see below), and forced me to exit my entire position, automatically of course.
DRYS - 2009-01-07 134810 - 10m

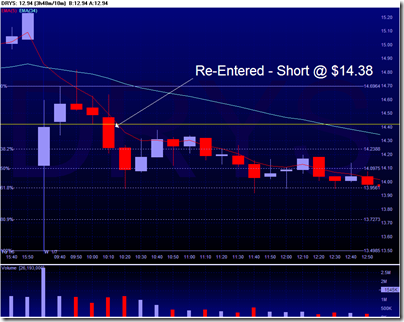
With all those self-belief in me, I decided to re-enter the trade, this time when the prices broke the Low of the 4th bar (Remarks:  I’ve switched from 15mins to 10 mins chart by now.)  This time, I tried to be more cautious and set my Protective Stop just right above the 5th bar high (meaning less R for the run.)
DRYS - 2009-01-07 134953 - 10m

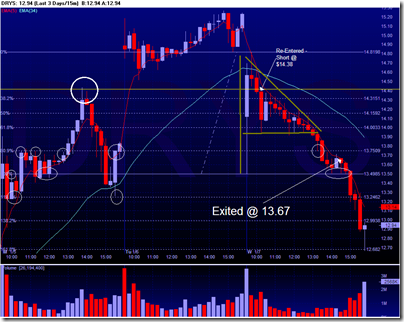
By now, I was trying to plot out the potential Support Levels for my exit, if necessary.  The Opening Bar’s range was so wide that I did have some doubts that it might not hit its Day-Low, today. 

I pulled the Fib from Day-High to Day-Low, and the most obvious Pilot Point was at the 80%Fib. Level.  And obviously, and again, at Day-Low.  (See circles in the Chart below.)

Although I did adjust my Protective Stop, I didn’t follow it too closely by changing the Stop to previous bar’s High.  If so, the very few Up-bar (Blue) that you see below might have exited my position.   Which prompts me to think… I need to really learn how to master the skills of determining my Protective Stops.

Unfortunately, I had to leave for a meeting, and I was forced to exit the trade right before 1400hrs.  Otherwise, I would have caught on to a very nice run.  Prices didn’t stop until hitting the 161%Fib!
DRYS - 2009-01-07 135455 - 15m

Monday, January 5, 2009

First Trade of 2009 - TBT

TBT - 2009-01-05 082347 - 5m

  • I thought I was looking at a ‘Cup and Handle’ setup, but soon after I entered the trade, I doubted myself
  • Not until I have entered the trade, I noticed that there were already 2 waves to long-solid up bar (see chart below)
  • And I was already prepared for an exit after the 3rd wave
  • Since the entry wasn’t ideal, I was particularly cautious
  • The down bar that you see below actually went all the below my entry-line

TBT - 2009-01-05 081947 - 15m

  • But as you can see below, prices did go above and beyond my target, of 138% Fib.

TBT - 2009-01-05 144756 - 15m

  • The good news is, this little trade still earned me a bit over 2R
  • I’m happy to start the New Year with 2R!

Thursday, February 7, 2008

020708 - AKAM - 10mins - Gain*Paper


Symbol: AKAM
Type: Long
Result: Gained +1.52R
  • Ooooouuuccchh!
  • This hurts! Why? Read on...
  • AKAM gapped up today but the first bar painted a long upper tail
  • I gave up on AKAM in the beginning, but I couldn't spot any other decent setups, and when I reviewed AKAM again, the 7th bar, Inside, caught my attention
  • I thought about entering Long, but chose not to because the 5eMA was just too far away
  • The next 2 bars went all the way up to the 119% Fib., and I thought I just missed this one
  • But prices came back down and since I still couldn't find anything decent to pay attention to, I turned my focus on AKAM
  • When the 11:50 bar painted an Inside-NR7 combo, I decided to set a Stop Entry 2 ticks above the opening high
  • I wasn't too confident in this trade because of the previous Resistance at the 119% Fib.
  • But my entry was filled soon after, and the prices basically moved sideway in narrow range
  • By 1300hrs, the prices started to rise!
  • I wanted to exit half of my position when the prices reached the 119% Fib., but I accidentally exited my entire position! (This is where the 'ouch' came from!)
  • As you can see, the prices continued to rise to reach my secondary target!
  • It hurts! But hey, I didn't lose money, so I'm still happy!

Friday, February 1, 2008

020108 - ALTR - 10mins - Gain*Paper


Symbol: ALTR
Type: Long
Result: Gained +1.85R

  • Picked up ALTR from Briefing/Jamie's Gapped-up list
  • Prices formed a Cup-and-Handle formation, with the 10:50 bar closed strongly above Opening Range High
  • The next bar (11:00) painted an Inside+NR7+Hammer(almost) combo
  • The only thing that I didn't like about that combo is that it is a red bar, instead of a blue bar
  • I decided to enter Long when prices break the high of the combo bar, with the bottom of the combo bar acted as my Protective Stop
  • Upon entry, prices immediately shot up, but pulled back
  • I didn't adjust my Stop and as long as the prices do not close under the Opening Range High, I was going to hang-in there!
  • My patience paid off! At 1pm, there was surge in volume after another Inside+NR7 combo bar
  • The prices went pass the 119% Fib. Level easily
  • It painted a Shooting Star at 2:40pm, right at the Pivot Point / Resistance Level (see second chart.)
  • I exited half of my position once the Shooting Star was completedly formed
  • I moved my Stop to just underneath the flattening 5eMA
  • My Stop was triggered 2 bars later
  • My first winning trade of the year! I'm happy! Something positive going into the weekend!

Feel free to share your trades!

Cheers and Good Trades!

Friday, October 26, 2007

102607 - CFC - 15mins - Gain*Paper

Symbol: CFC
Type: Long
Result: Gained +4.67R

  • Countrywide Financial gapped up on positive outlook today
  • Prices retraced to the $15.25 level for most of the morning, forming quite a few Narrow-Range bars, which caught my increased attention
  • The 12:45pm bar was an Inside-bar, with NR7. It almost made it to a Hammer, except for that tiny Upper Shadow
  • I decided to take a low-risk entry to go Long when prices broke the high of the NR7 bar
  • I set my Buy-Stop order 2 pennies above the high of the NR7 bar, with my stop set to the bottom of the NR7 bar
  • My order was triggered almost immediately

  • The Blue line that you see above was my Primary Target.
  • I observed the Daily-Historic chart and noticed that there was a low back in September that might serves as a potential resistance level (see below.)


  • It didn't take too much time before the prices reached the 'blue-line.'
  • As soon as I have sold half my position at blue-line, I moved my Stop to the bottom of the 13:30 bar (10mins, see below, the black one!)
  • The 13:40 bar, unfortunately, just touched my Protective Stop and sold the remaining half of my position
  • I thought about a re-entry on the same bar that I was Stopped-out, because it was a nice little Hammer bar.
  • I chose not to re-enter Long because the same blue-line that I drew was like flashing at me, telling me that "hey, you drew this! Remember?"
  • Plus, the winning that I already have, although on paper, is already making me very happy! (See how I am easily satisfied? Don't know if that's a good thing for a Trader though.)


  • The prices did continue to rise!
  • It even went past the opening high, and went all the way to the 113% Fib Level (Yesterday Low / Today's Opening-High)
  • I captured the chart below, before the market closes, so that I can journal this trade before my meeting
  • Even though the words of wisdom of Jamie did play-back in my head as I was entering the Stop level for my remaining half position, I chose to play it safe! What I'm referring to, is a rule that I learned from Jamie... "Prices usually ends its rally after 3 Wide-Range-Bars" (also see chart below.)
  • I chose to play it safe, and secure my winnings
  • But in this case, I left a lot on the table!
  • Was my 2nd Stop set at a wrong level?
  • My entry was based on a 15min chart, had I used the same 15mins (instead of 10mins), I might have been okay! So did I use the wrong chart to set my Stop?

Thursday, October 25, 2007

102507 - EMC - 10mins - Gain*Paper

All the notes are written on the chart. I have to run to a meeting, and a busy evening. I didn't lose money; I'm happy!

Friday, October 19, 2007

101907 - SNDK - 5mins - Gain*Paper


Symbol: SNDK
Type: Short
Result: Gained +2.77R
  • I wanted to enter Long when prices first broke under the Opening Low
  • But I though the 5eMA was too far away, and therefore, I waited
  • The prices started to retrace, and posted several NR7s
  • The 11:25 bar even formed a NR7 + Inside Bar
  • I entered Short when prices fell below the 11:25
  • My target was the 119%
  • I did exited half my position only when the prices reached 119% the first time
  • But I told myself that I want to secure the winnings, and therefore, I decided to exit my entire position a few minutes later
  • The thing is... I wonder on a down day like today, how significant is my training/winning?
  • It's almost like... pick anything and it will drop!
  • Now I know why one is supposed to take notes on the overall market mood in the trading journal as well


Friday, October 5, 2007

100307 - RIMM - 15mins - Gain*Paper

Symbol: RIMM
Type: Long
Result: Gained +0.7R

  • I failed to spot an entry on RIMM early this morning, but it remained on my watchlist
  • After the prices reached its Day-high, it retraced a bit and the rising 5eMA performed well as Support
  • I was hoping for a 2nd rally when the prices break Day-High, and ran for 138% Fib (from yesterday's low to today's high.)
  • I entered Long when the prices broke the day-high (see top yellow line)
  • It didn't get to where I wanted it to go
  • Fortunately, I had to leave my desk for a meeting and therefore, I had to exit my position
  • Otherwise, my Protective-Stop would have triggered during the next bar, which only means less profit
  • But at least it's a winning trade!
  • Have a great weekend, and Long weekend to those in Canada!


Wednesday, October 3, 2007

100307 - PNRA - Long - Gain*Paper

Symbol: PNRA
Type: Long
Result: Gained +3.35R

  • You can probably tell that the Hammer painted before 11am was the trigger for my Long entry
  • However, today is the first time that I started using IB's Paper Trading platform, it took me a while before I managed to completed the order
  • By then, the prices went up a bit further, but it later retraced, and painted another Hammer
  • Fortunately, my Protective Stop was never reached
  • But I wasn't too happy with the lack of volume either
  • I thought about exiting the trade, but decided against it. Partly because it has been a very busy morning (I didn't even have enough time to completely go over every single stock on my shortlist!)
  • Anyway, prices continued to rise, and you can see, and when prices crossed the Day/Opening-High, I paid closer attention to the price movement
  • I noticed that the 5eMA was too far below, and an Upper Shadow is beginning to form, so I decided to exit my trade and pocket the profit!
  • I told myself that even if the prices continue to rise, if I can start my month with a positive trade, I'm happy!
  • And this is the only trade that I made today


Thursday, August 30, 2007

083007 - KG - 15mins - Gain*Paper


Symbol: KG
Type: Long
Result: Gained +0.86R

  • Drew a potential Pivot Point (see blue line), which is slightly above the Opening Range High
  • Drew Fib from Day low to Day High
  • KG painted a Hammer during the 7th bar, closing above the 5eMA, but just slightly below the Day High
  • Entered Long when prices break above the Day High
  • Continuously adjusted my Stop to the bottom of the previous bar
  • Got Stopped-out during the 12pm bar
  • A very small gain

Tuesday, August 28, 2007

082807 - AMZN - 15mins - Gain*Paper


Symbol: AMZN
Type: Short
Result: Gained +0.63R

  • I didn't have much time to pay attention to the market today
  • I ran into AMZN this morning, just right after it broke the Opening Range Low
  • I quickly entered Short, but the prices retraced sharpely during the next candle forming and long Hammer
  • I thought about closing my position for a Break Even trade, but decided to wait till if/when the prices closed above the 5eMA
  • It didn't and the prices fell again
  • Since I had to leave my desk soon, I decided exit my entire position after seeing the 11:45 bar painted a lower shadow
  • A rather small gain

Tuesday, August 21, 2007

082107 - ASN - 10min - Loss*Paper


Symbol: ASN
Type: Long
Result: Lost -1R

  • Well, I missed the first entry, and I was hoping that there will be a 2nd round of run
  • I entered Long as prices crossed the yellow line (see first chart)
  • It did made a very-mini-run, but failed
  • I thought about exiting earlier to avoid a full 1R loss, but I was too optimistic... thinking that it might bounce
  • I was wrong and my Stop was triggered
  • Below is the full day view of ASN

Monday, August 20, 2007

082007 - AA - 15mins - Gain*Paper


Symbol: AA
Type: Long
Result: Gained +0.37R

  • Although I made a very small profit from this trade, this trade should not have materialized to begin with
  • First, the 10:00 and 10:15 bars have very long Upper Shadows
  • Second, the risk to rewards is questionable
  • Third, the Hammer bar (4th in chart) had no significance volume
  • Anyway, my target was at Day's High
  • I knew, upon entry, that this is a less-than-ideal entry, therefore, I was cautious
  • As soon as the prices broke below the 11:15 & 11:30 low, I exited the trade
  • A very small gain on a poor trade... considered myself lucky on this one!
PS. Blogger is saying that there's a scheduled outage beginning at 7p EST. I don't know how long it will be out. Just so you know.

Thursday, August 16, 2007

081607 - CFC - 10mins - Gain*Paper


Symbol: CFC
Type: Short
Result: Gained 4.06R

  • Today's shortlist was long... so long that I almost didn't want to deal with it because of my other work load
  • I left the screen up, and paid attention to a few that haven't tanked!
  • At around noon, CFC's prices fell to covered the lower shadows of the previous bars
  • Earlier, I saw an inverted Hammer from the 5mins chart, but I decided against it because of those lower shadows
  • I entered Short at $17.47, with my Protective Stop set at the high of the same bar
  • Prices then hit Day Low, followed by a Gap-Down
  • I was hoping that the prices will hit the 138% Fib.
  • It didn't, but I exited just in time before the rebound
  • Another gain! I'm happy!

Wednesday, August 15, 2007

081507 - PAYX - 10mins - Gain*Paper


Symbol: PAYX
Type: Short
Result: Gained +0.87R

  • PAYX came from Trader Jamie's Watch List as posted on his blog here
  • The reason why this is on his Watch List is because (I think) there is a potential that PAYX can fall through a major Pivot Point at $44.00 (see yellow line)
  • Prices reached the Pivot Point at 1000hrs and retraced
  • I saw a mini-base forming at around 1000hrs, and I entered when the prices breached the base
  • But once I have entered Short, I realized that my trade was (almost) pointless!
  • Because if I already knew that a Pivot Point (a potential support!!) is at $0.19 cents away, it really makes my Rewards to Risk ratio of this trade looks poor! (My Protective Stop was at the Entry Bar's High)
  • With this knowledge in mind, I became more cautious with my trade management, and prepared to exit my trade at any moment!
  • Since I (or no one) knows if the prices will go through the Pivot Point, with force and authority, I long decided to exit half of my position when it reaches the Opening Low
  • I watched closely after my first half exit, and re-adjusted my Stop
  • I was Stop-out during the next bar
  • Although the prices did managed to breach the Pivot Point, several times, it failed to dive further
  • PAYX will be on top of my Watch List tomorrow!
  • A 0.8R gain is still better than nothing!

Tuesday, August 14, 2007

081407 - MAT - 10mins - Gain*Paper


Symbol: MAT
Type: Short
Result: Gained +3.14R

  • First of all, I almost entered Long during the 12:50 candle, when the prices broke the Day-high.
  • But I decided to wait for the completion of the candle, as a confirmation, but it failed to close above Day-High
  • I stayed tune to MAT see which way it was going to go
  • It painted consecutive NR7's and Inside Bar (does zero price movement even considered as NR, or IB?), setting up a Base.
  • Then at 13:50, it fell below the Base
  • My Protective Stop was set to the high of the 1pm bar
  • As the prices fell, I adjusted my Stop to follow the previous bar High
  • My initial target was the next Fib. Level. But looking at the Historical chart, it appears that there's a potential Pivot point around the $22.76 level (see yellow line)
  • Therefore, I adjusted my primary Cover point to $22.76, which it did get there
  • I was Stopped-out during the next bar
  • A 3R+ gains... I'm happy!

Friday, August 3, 2007

080307 - NTAP - 5mins - Gain*Paper


  • NTAP gapped down and quickly consolidated near the 80% Fib. Level
  • The 4th bar in the 15mins chart (first chart) crossed the Opening Range Low, but the 5eMA looked too far away
  • I then turned to the 5mins chart (second chart) and noticed that the consolidation range at the 80% Fib. Level were narrowing, with decreasing volume, and NR7 bars
  • It then followed by an High-Volume bar that breached the Opening Range Low (the 10:20pm bar)
  • Therefore I decided to take a chance
  • My Protective Stop was set to the high of my Entry Bar
  • While my initial target was the 119% Fib that was drew from yesterday's high to today's Opening Range Low, on the 15mins chart
  • After entering the trade, I also plotted another Fib on the 5mins chart from Day High (1st bar) to Day Low (3rd bar, at that time)
  • After seeing the Fib on the 5mins chart, I decided to adjust my primary target to the 161% Fib. on the 5mins, and the secondary target would be the 119% on the 15mins chart
  • I continued to adjust my Stop as the prices went down
  • I was 100% Stopped out durig the 11:25 bar
  • And the prices eventually reached my secondary target
  • A gain of close ot 5Rs
Not too bad! Now to all traders out there, I hope you will have a wonderful weekend!
atest

Thursday, August 2, 2007

080207 - GYI - 15mins - Gain*Paper


Symbol: GYI
Type: Long
Result: Gained +2.54%

  • This is my final trade of the day
  • GYI gapped down today and it continued to went down forcefully!
  • All day I was dreaming/wishing that I made an entry as prices broke the Opening Range Low
  • But I checked and checked, and I really couldn't spot any entry signals (I later posted a question to OONR7 for his opinion, and I will copy his response below)
  • Since I couldn't ride the wave down, I thought to myself if I can spot any reversal signal, I am going to challenge myself for a retracement ride back up for a few quick dollars
  • At 12:45, GYI painted a almost-Hammer shaped bar off a downward slope, signaling a base is being hammered
  • I waited patiently for a reversal confirmation, which I received in the following bar
  • I entered Long once prices exceeded the high of the 'confirmation' bar, with the Protective Stop set the to the low of the 'confirmation' bar
  • My initial target was the 61.8% Fib Level, with a hope that it will ran all the way back up to meet the 34eMA
  • I exited half my position at during the 14:30 bar when the prices reached my target
  • I exited the remaining half - only because I had to run to a meeting!
  • As you can see, it turned out to be an excellent 'exit.' :-)
  • Although this trade did work out... I doubt that this will be my primary style of trading. Predicting the reversal is just as challenging as predicting the entry. Oh well there's still a whole lot for me to learn. And with the constant and unconditional help from these folks below, it just makes me want to work even harder to improve my trading!
OONR7's comment:
closet... think I would've immediately removed GYI from my watchlist because it didn't have a nice wide-range open. Also, didn't really see my kind of entry on the 5-min chart. The 10am bar looked the most interesting but it left a lower tail at the ORL. Just not a lot on the chart for me to get exicted about except for the end result.
And I just noticed that Jamie, from Wall St. Warrior, also left me this message from OONR7's blog:
GYI was on my watch list today. I wanted to short it after the NR inside bar (7th bar). However, the downsloping 5 ema was just too far away and I passed. Shoulda woulda coulda shorted it after it took out the midmorning swing low.
Thank you both!