
I tried, but didn't spot any good setups today. Partly because I'm trying to be more selective in choosing which/what trade to enter; partly because it has been such a busy day at work.
The iPhone is available in store today. There are many sites that have done review on the iPhone, therefore I don't want to bore you with another review. Instead, checkout this video. It is kind of funny! Turn up the volume because you have to listen to the conversation.
Meanwhile, I will summarize my Month-end result and post it during this weekend. Until then, I hope you all have a great weekend!
Thank you for reading my Blog.
Saturday, June 30, 2007
No setups today... but check-out this iPhone video
Thursday, June 28, 2007
062807 - LSI - 15mins - Gain*Paper


 Symbol: LSI
Type: Short
Entry: During the 6th bar
Exit: During the 15:00 bar
Result: Gained +4.62%
- The upside down Hammer from the 5th bar (15mins) was what caught my attention
- I entered during the 6th bar, which looking back now, I don't think it was a good entry point
- Instead, I would rather enter during the 9th bar, when the prices cleared the low of the 6th and 8th bar
- Also, the entry was NOT close to the 5eMA at all
- Luckily for me, it all worked out
- If you look to the 10min chart, you can see that there are a lot of Lower Shadows, when prices reached the $8.05 level
- Well, I entered Short, and the prices just kept on falling
- I thought about exiting at least half of my trade when the prices were near the 119% Fib Level
- But I told myself that the prices was probably just trying to close the gap against the 5eMA. It did and it continued to fell
- The blue line that I drew, right underneath the 138% Fib, is a potential Support level that I derived from the Daily Historical chart. In this case, I was fairly accurate
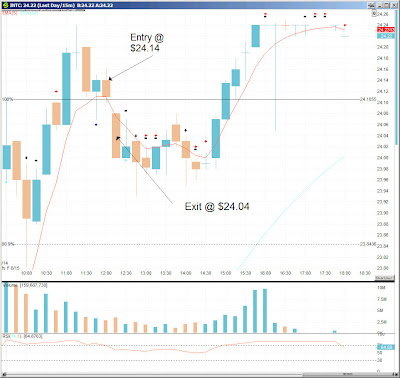
062807 - IMMR - 15mins - Loss*Paper

 Symbol: IMMR
Type: Long
Entry: During the 11:45 bar
Exit: During the 11:15 bar
Result: Lost -0.41%
- (IMMR) gapped up and retraced back to the $14.35 level
- Prices began to consolidate near $14.48, setting up a Base & Break setup
- My Long order was set when prices exceed $14.50
- But the prices iteself 'gapped-up' just moments before noon
- My Entry was actually at $14.60 (See the other screen)
- A doji was formed during the next bar
- The next 2 bars leading into 12:30 both have Upper Tails, which made me uncomfortable
- I exited my trade when prices dipped below the 5eMA, and the 50% Fib. Level (between Day High and Low)
- I thought about re-entering when the next bar formed a Hammer
- But since there were no volume I decided to cancel my plan
- Prices never went far, and it later turned south
Wednesday, June 27, 2007
062707 - TSO - 15mins - Loss*Paper

- I made a Short entry at $55.37
- Because of the inverted Hammer at 10:30, with increased volume
- And the 'confirmation' by the 10:40 bar

- After the entry, I flipped over to the 3 minute bar to see what it looks like, and decided to capture the screen (in real time) for future reference

- By now, we can see that the price has bounced back up a little in the 5 minute chart


- My Protective Cover was hit shortly after
It has be/will be a busy day for me... that's why I'm posting early. I wasn't really into trading today because of the hectic schedule.
I'm considering to capture more 'as-of-entry' type of charts for my trades, hoping that it will better help me to identify the good/bad setups. I'll see how it goes.
Otherwise, that's all I have for today.
Thanks for reading!
Tuesday, June 26, 2007
062607 - CCE - 10mins - Gain*Paper


Symbol: CCE
Type: Long
Entry: During the 11:10 bar
Exit #1: During the 11:50 bar
Exit #2: During the 12:50 bar
Result: Gained +0.87%
- I was trying another Base and Break setup, and this time it was on a 10 minute chart
- The prices 'gapped-above' the Opening High during the 11:10 bar, and I entered Long
- I exited half my position at the 138% Fibonacci Level
- I exited the remaining half of my position fell back close to the 5eMA
- The red line is drawn based on the Daily High back in late March (see 2nd chart). I was anticipating resistance at that level
- It turned out that the prices just went past it
- Since it is somewhat a Pivot Point, I wonder if the prices will continue to rally tomorrow
- Finally... a winning trade!
062607 - NU - 15mins - Loss*Paper
 Symbol: NU
Type: Long
Entry: During the 12:15 bar
Exit: During the 12:45 bar
Result: Lost -0.25%
- The yellow that I drew was what I thought the base and I entered Long after the prices raised above that level
- I had a very tight Protective Stop because I wasn't too sure with this 'speculative' setup
- It turned out that my vision of this setup was invalid. Prices fell and my Stop was executed
062507 - DCEL - 10mins - Loss*Paper
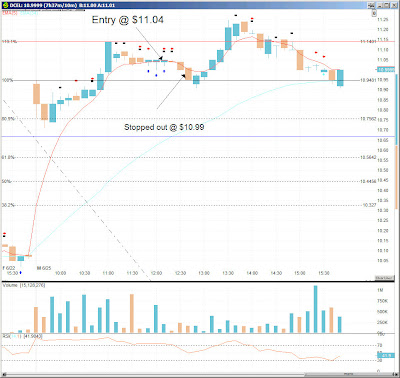
Symbol: DCEL
Type: Long
Entry: During the 12:10 bar
Exit: Stopped out during the 12:40 bar
Result: Lost -0.45%
Type: Long
Entry: During the 12:10 bar
Exit: Stopped out during the 12:40 bar
Result: Lost -0.45%
- I tried a 10-minute chart this time
- The prices hit the Fib Level and retraced back to the 5eMA
- It hovered around the eMA for a while, and formed a few consecutive hammers
- I entered during the last hammer of the sequence thinking that I would still yield a 1% gain if prices merely return to the Fib
- I also noticed the rise in Volume, thinking that it's another signal confirming another small rally
- But only if it's that easy! The prices retraced further back to the Opening High, before reaching my Target, plus a bit more
- Sadly, my Protective Stop has already been executed during the retracement to the Opening High
062507 - AOB - 15mins - Loss*Paper
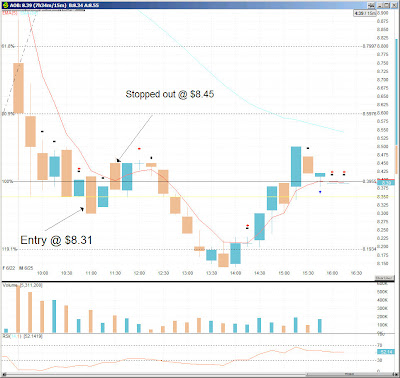
Symbol: AOB
Type: Short
Entry: During the 7th bar
Exit: During the 9th bar
Result: Lost -1.68%
Type: Short
Entry: During the 7th bar
Exit: During the 9th bar
Result: Lost -1.68%
- I drew the yellow line to remind myself that if the prices broke the base (yellow line), I will go Short
- As soon as I entered Short, the prices started to retraced back to, and went over, the 5eMA
- My Protective Stop was hit eventually, resulting in another loss!
- The frustrating thing is to see that the prices did fell later to reach my targets!
062507 - IPG - 15mins - Loss*Paper
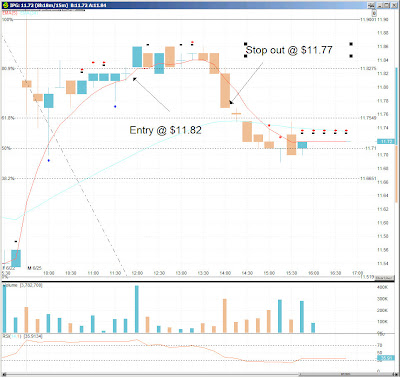
Symbol: IPG
Type: Long
Entry: During the 11:45 bar
Exit: Stopped out during the 14:00 bar
Result: Lost -0.42%
- The 9th bar Hammer was formed and I told myself that the 5eMA cannot be anymore closer!
- I entered Long during the next bar and the "rally" stalled shortly after
- Eventually, my Protective Stop was hit, and I was left very disappointed
Thursday, June 21, 2007
June 21, 2007
I have a few meetings coming up, and therefore, I want to get today's postings out now, rather than later.
NVDA and HOKU made some serious runs! Too bad I wasn't able to spot an entry. (I hope the pros did, and I look forward to read about them.)
Meanwhile, the 3 trades that I did today were all screwed up! Check them out below! :-(
There will be no trading tomorrow, 6/22, as I have a day-long meeting! I hope all my readers have a wonderful weekend!
Thanks for reading my Blog!
062107 - AM - 15mins - Loss*Paper
 Symbol: AM
Type: Long
Entry: During the 8th bar
Exit: During the 13:15 bar
Result: Lost -0.41%
- Looking back now, I really didn't have a good signal that prompted me for entering
- Although the 3rd bar is bullish, the 4th - 6th bar really didn't tell much
- I entered long soon after the prices covered the 4th bar high (I was 'hoping' for a Base Break setup)
- Since then, the prices began to consolidate, hovering around the $26.95 level
- I tightened my Protective Stop to just underneath the 11th and 13th bar low
- It was reached during the 14th bar
- At time of editing this post, the prices finally started to move up
062107 - ANDE - 15mins - Loss*Paper
 Symbol: ANDE
Type: Long
Entry: During the 5th bar
Exit: During the 5 bar
Result: Lost -0.75%
- I saw the 4th bar as a Bullish Reversal signal and I entered on the 5th bar when prices covered the 3rd bar Upper Shadow
- Again, even as I was entering the trade, I questioned myself if the 5eMA is too far away?
- When prices started to pull back, I panicked and exited the trade
- As you can see, this trade would have yielded quite a bit of profit
- It shows that I still have a lot to learn!
062107 - BAM - 15mins - Loss*Paper

Symbol: BAM
Type: Long
Entry: During the 4th bar
Exit: During the 12:30 bar
Result: Gained +0.13%
- Right after the Hammer was formed on the 3rd bar, I waited till the prices have covered the Upper Shadow of the 2nd bar before entering Long
- When the prices got pushed back a little, during the 3rd bar, I was wondering if I had made the right decision
- Because the 5eMA was quite far away
- It turned out well, and when the prices consolidated around the 80% Fibonacci, I tighten my Protective Stop to just underneath the 7th bar low
- I guess my Stop was too tight!
- The Protective Stop was executed before the prices ran towards to the Opening High, which was my Primary Target
- :-(
Wednesday, June 20, 2007
What is it like being a Trader with JPMorgan?
Here is a recruiting video provided by JPMorgan, directly from JPMorgan's web-site. It briefly shows what is it like being a Trader at JPMorgan. I don't think I have learned anything from it, but it just a video that I think it's worth a quick look.
Do feel free to let me know what you think.
http://eurocareers.jpmorgan.com/content/content_273.asp
062007 - CLC - 15mins - Gain*Paper
 Symbol: CLC
Type: Long
Entry #1: During the 7th bar
Exit #1: During the 8th bar
Result #1: Lost -0.64%
Entry #2: The beginning of the 10th bar
Exit #2: During the 15th bar
Result #2: Gained +0.75%
- The 6th bar came across to me as a Hammer, and the fact that the real body of the bar had the previous completely covered, I saw it as a Bullish signal
- I entered Long when the prices closed above the 4th bar high, and set my Protective Stop at just under the 5th bar low
- My Stop was hit during the next bar, and I questioned myself if my Stop should be set to the 6th bar low
- With both the 8th and 9th bar low failed to go under the 6th bar lower, along with the rising 5eMA acting as potential Support, I decided to re-enter the trade again
- I entered at the beginning of the 10th bar and things looked better this time
- I tighten my Stop later to underneath the 12th bar low, and it was reached during the 15th bar
062007 - IFX - 15mins - Loss*Paper
 Symbol: IFX
Type: Long
Entry: During the 7th bar
Exit: During the 13:00 bar
Result: Lost -0.12%
- Once the Hammer has formed from the 3rd bar, I was eager to enter
- But I wanted to wait for the rising 5eMA to get closer
- I never had the chance for entry as prices soared during the 5th bar
- During the 7th bar, the prices retraced a bit, and I took the opportunity to enter
- The prices consolidated during the next 90 minutes
- During the 13:00 bar, it fell through my already tightened Stop, resulting in a very small loss
062007 - JNC - 15mins - Gain*Paper

Symbol: JNC
Type: Long
Entry: During the 14th bar
Exit: The 14:30 bar
Result: Gained +0.08%
- (JNC) gapped up and retraced back to the rising 5eMA
- I was aware that the Opening Bar was not a Wide-Range Bar, and therefore, I was cautious with this trade
- I entered Long as prices exceeded $63.20
- I was hoping that the prices will make it all the day back to the Opening High, but at around 14:30hrs, it began its reversal
- Fortunately, I was just about to tighten my Protective Stop, and it hit my Stop almost immediately
- A very small gain
Tuesday, June 19, 2007
061907 - LNET - 15mins - Gain*Paper

 Symbol: LNET
Type: Long
Entry: The 13th bar
Exit: 1/2 @ 14:45 bar; 1/2 @ 15:45 bar
Result: Gained +0.97%
- Although a Hammer was formed on the 12th bar, I was a little concerned by the long Upper Shadow of the 11th bar
- Since the prices were in proximity of the rising 5eMA, I decided to give it a try
- My Protection Stop was set to just underneath the low of the 12th and 13th bar
- I exited half of my position when the prices reached the high of the 11th bar
- I exited the remaining half of my position at the blue line ($34.43)
- The blue line is drawn based on the daily-historical chart (see 2nd chart). It was from the mid-April high
Saturday, June 16, 2007
061507 - INTC - 15mins - Loss*Paper
Symbol: INTC
Type: Long
Entry: The beginning of the 11th bar
Exit: The 12th bar
Result: Lost -0.41%
- The one is a total mistake!
- There's a doji formed from the 8th bar, followed by a reversal confirmation on the 9th that I somehow have completely missed!
- The 10th, was not even a true Hammer!
- What the hell was I thinking? I must have traded too much this week!
061507 - WMB - 15mins - Loss*Paper
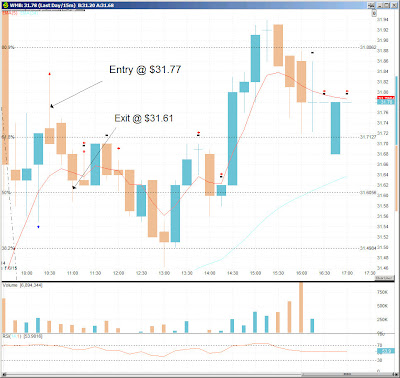
Symbol: WMB
Type: Long
Entry: During the 5th bar
Exit: During the 7th bar
Result: Lost -0.5%
- 4th bar was a Hammer
- I waited the 5th bar to go above the 3rd bar high before entering Long
- The prices went up a little bit further and then started to fall
- My Protective Stop was triggered 2 bars later
- :-(
061507 - BGC - 15mins - Loss*Paper
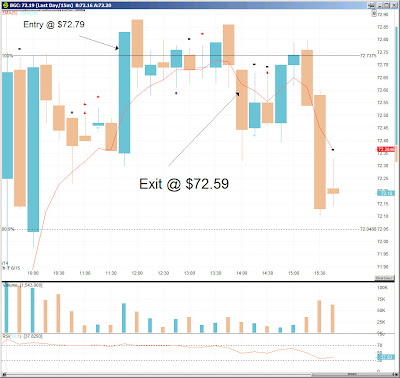
Symbol: BGC
Type: Long
Entry: The 10th Bar
Exit: The 19th Bar
Result: Lost -0.27%
- The prices went crazy during the 10th bar
- I entered because I thought the Upper Shadows of the first 4 bars all demonstrated some resistances near the Opening High; and since the 10th bar was able to ran right through it, it must be a strong bullish signal!
- Well, you can see that it wasn't quite the case!
- I was stopped-out during the 19th bar
061507 - SWHC - 15mins - Loss*Paper
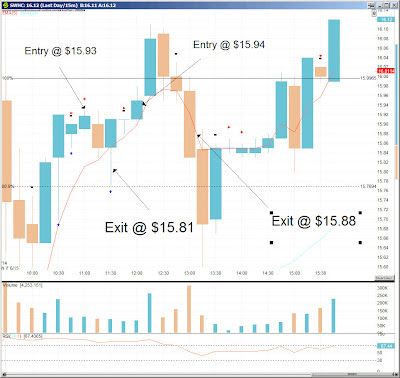
Symbol: SWHC
Type: Long
Entry #1: The top of the 7th bar
Exit #1: During the 9th bar
Result: Lost -0.75%
Entry #2: During the 11th bar
Exit #2: During the 15th bar
Result: Lost -0.38%
Entry #1
- I saw 2 Hammers in a row and I thought it would be the time to enter
- When the prices went above the high of the 5th bar, I entered Long
- When the next bar went back towards the 5eMA... doesn't it sounds familiar?
- The next bar fell below the 5eMA and executed my Protective Stop
- It turned out that the 9th bar was just another Hammer
- With some frustrations, I decided to enter Long again during the 11th bar
- It was in close proximity to the rising 5eMA, and the entry price was already above the 7th bar high
- It turned out that the prices did went past the Opening Range High!
- But the problem was, I had to step away from my desk and I couldn't watch the trade to unfold. I set the Protective Stop based on my entry - slightly below the 5eMA at time of entry
- Had I watch the movement unfold in real-time, I would have adjusted the Stop to the Opening Range High as soon as the price went past it
- In fact, since this is Paper Trading only, I could have recorded the exit at Opening High. But I rather not. I want it to be as close to 'reality' as possible
- Therefore, another loss!
061507 - PENN - 15mins - Loss*Paper
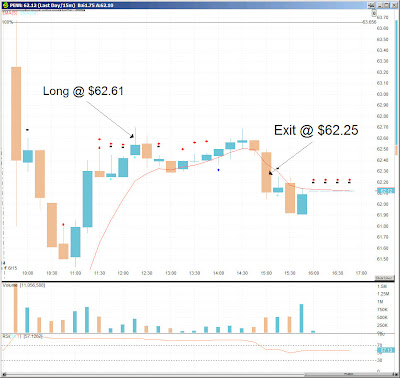
Symbol: PENN
Type: Long
Entry: The beginning of the 11th bar
Exit: During the 3pm bar
Result: Loss -0.57%
- I saw the 8th - 10th bar constructed a Support zone at around $62.25
- So when I saw the prices closed above the 8th AND 2nd bar high, I entered Long
- My Protective Stop is set to just underneath the Support zone mentioned
- Now that I'm reading the chart again... didn't Jamie, at Wall St. Warrior, told me to place my Entry as close to the 5eMA as possible?
Friday, June 15, 2007
Frappr
A few days ago, my friend showed me this site called Frappr. I checked it out and it turns out to be a web site that utilize Google Map's API to develop a "Facebook on a map" kind-of-site.
Basically, once you have created the account, you will get to create your own map(s). Each map will get its own URL, and the idea is that this 'map-page', technically, can serve as your 'home-page', similar to your own Facebook page, or Myspace page. Better yet, you can embed this map onto any html web page that you have. In this case, I put it on this blog.
The site is still in Beta, and there is noticeably a few bugs here and there. And their Graphical User Interface (GUI) is not the friendliest either! Anyway, I kind of like the idea and decided to give it a try.
The map below is the one map that I created. It is called
"Where are the Wall St. Traders around the world?"
The idea is that I hope all the visitors to my Blog will take a few seconds to tell me, and other readers, where do you do your trading from. **** The one good thing that I like about Frappr is that Visitors who want to participate DO NOT HAVE TO SIGN UP for another new account!
Anyway, you just give a name, your location, and upload a picture if you want to. Since I'm supposed to be in the closet, I selected Maldives to be 'my location.' (Yes, I've been there once and I loved it!)
In addition to the larger map that I embedded in this post, there is a small map embedded on the sidebar of this blog for easy reference in the future.
Well, try it out if you have time. If you have even more time, drop me a note and tell me what you think?


Thursday, June 14, 2007
First Esto, now Trader-X?
I just found out that Trader-X has decided to stop blogging, at least for now.
Kevin at Kevin's Market Blog also hinted that he will cut down on posting in the near future.
Esto, as mentioned earlier, has already shut down his blog. (In fact, I just took his site/link out of my 'closet links' last night!)
At this rate, I'm going to run out of blogs to learn and improve on my trades very soon!
Just to force myself to look to the positive side, at least Jamie at Wall St. Warrior took the time today to give a pad on my back! Thanks, Jamie! And as I was studying his blog today, I came across the following comment:
Flatwallet said...Just tell me that you aren't going to quit any time soon.
Jamie said...
I sometimes worry that I'm a slave to the blog, while other priorites fall behind. I'm sure you can relate. But I'm hanging in.
061407 - ADSK - 15mins - Gain*Paper
 Symbol: ADSK
Type: Short
Entry: The 7th bar
Exit: #1 @ the 10th Bar
#2 @ the 14th Bar
Result: Gained +1.99%
- The 5th bar painted a Hammer
- Don't know why, but I didn't feel comfortable entering Short during the 6th (I think I have lost some confident)
- I entered Short at the beginning of the 7th
- My Protective Stop is set to just above the 5th bar high
- As prices fell beyond the Opening Low, I adjusted the Stop to the Opening Low
- I drew the Blue Line to remind myself of a potential support from Mid-January's high

- I exited half of my position at the Blue Line
- As prices fell right past my Blue Line, and I re-adjusted my Stop to the Blue Line
- I later re-adjusted my Stop to the 138% Fibonacci Level as the prices fell past it
- I exited the remaining half during the 14th bar when I felt that the prices were heading for a reversal. (see 10 minute chart below)

Wednesday, June 13, 2007
061307 - SAPE - 15mins - Loss*Paper

Symbol: SAPE
Type: Long
Entry: The 10th bar
Exit: The 11th bar
Result: Lost -0.62%
- I saw that Hammer on the 9th bar thinking that the prices might just ride along the rising 5eMA
- I entered at the beginning of the 10th bar, and set my Protective Stop to the low of the 8th bar
- My Protective Stop triggered when the prices touched my pre-defined level, and the prices of the stock later went North for a bit.
061307 - NFLX - 15mins - Loss*Paper

Symbol: NFLX
Type: Short
Entry: The 9th bar
Exit: The 18th bar
Result: Lost -0.68%
- I entered thinking that the price had finally cleared the Opening Low, and it was also a gapped-down bar, from the previous... bearish! I thought!
- But it seems that the Support held up strongly and eventually my Protective Stop triggered when the prices bounced back.
061307 - HS - 15mins - Gain*Paper
 Symbol: HS
Type: Short
Entry: The 9th bar
Exit: The 2nd to last bar before closing
Result: Gained +0.21%
- I saw the 6th - 8th bar as a strong bearish signal, and I entered right at the beginning of the 9th bar.
- The prices just went sideway, with very little volume.
- The volume picked up a bit later in the afternoon, but there were still no significant movement
- I tighten my stop a bit...
- and eventually, i just exited the trade shortly before closing to earn a very small profit
Valuable information from Jamie! Thanks!
I just want to share with my 3 readers what Jamie, at Wall St. Warrior, has suggested me to work-on.
Earlier today, I posted a comment on Jamie's site inquiring about his entry point on his CMG trade made today. Here is my comment:
Jamie,
Re: your CMG trade...
How much of a concern for you that the prices might not go beyond the Lower Shadow of the Hang-man, at the moment of entry?
Because I would enter 2 bars later on this same setup, and I'm trying to understand what was going through your mind at that time.
Thanks!
And this is what he wrote...
The hanging man is a pretty strong sell signal. Once the HM was confirmed, I felt that price would take out intraday support and head towards daily support near Thursday/Friday lows.
It's all a balancing act. How many points in my favor versus the potential hurdles. I also liked the proximity of the declining 5 period EMA. Usually a stock sets up a reversal after it is has strayed too far from the MA and that is not a good time to enter, but can be a good time to lock in some profits.
In addition, Jamie also took the time to review some of my trades, and made the following recommendations...
I just read a few posts on your blog and I see that you are very focused on covering your shadows. If I may, I'd like to suggest that you try putting more emphasis on entering as close as possible to the 5 period EMA once your stock has established direction. That means the ema has a nice slope to it.
I am very grateful that Jamie actually took the time to check-out my blog, and to comment on it. He just did it out of his own time!! I am also certain that my 3 loyal readers also appreciate Jamie's input, which I'm sure that they will benefit from it too! Thanks again, Jamie!
Update: Jamie later also posted...
- Jamie said...
-
CDT,
Your welcome. Just to clarify the point I was trying to make.
On a flat or shallow base and break setup, I would cover my shadows. On a trending setup where there is a nice slope to the 5 period EMA, I look to enter as close as possible to the ema.
Tuesday, June 12, 2007
061207 - NITE - 15mins - Gain*Paper
 Symbol: NITE
Type: Long
Entry: The 17th bar
Exit: The 21st bar
Result: Gained +0.5%
- I had 12 stocks on my list today, and only this one convinced me to make a move.
- Had it not for the long Upper Shadow of the 7th bar, I would have entered somewhere along the 9th bar.
- Because of the 7th's Upper Shadow, I wanted to make sure the prices covered the Upper Shadow before I even start looking for a potential entry.
- the 14th - 16th bar set up some kind of an Upper Base (see yellow line.) Although there were no Inside Bars, or Volume indicators, I decided that I would enter Long if the prices cleared the yellow line
- It happened on the 17th bar, and I thought I hit the Jackpot looking at the way the 18th and 19th (beginning) had gone.
- I should have exited when prices fell below the Opening price during the 19th. But it wasn't easy because the next Fib. Extension seemed, at one point, so within reach.
- I waited and the prices began to fall. I adjusted my Stop to just below the 20th, and it executed almost immediately
- If someone can explain to me what 19th - 21st bar mean, please leave a comment. They gave me big question marks!
- Overall, I'm just glad that I have a 'plus' day!
Monday, June 11, 2007
No trading today!
Congratulations to OONR7 for establishing his/her new blog! I look forward to more learning experiences from the blog.
(Looks like there is a problem with Blogger too. I cannot load a few Blogs that I frequent.)
Friday, June 8, 2007
A Portable Daytrading Platform... Possibly?


For those who just cannot stop (Day)trading while you're on the road, or on vacation, and think that your 17" widescreen laptop is still lacking some serious screen space for you to spot your Bullish Engulfing candle over the rising Moving Average, here's a potential solution for you!
A portable, multi-screen, "laptop." It is based on a laptop, but it doesn't really fit on the lap. The entire unit builds right out of a case. There are two removable panel, one for each side, to let you hook them to the side of the "laptop", to give you a multi-screen display. This will provide you with extra desktop space (for trading), while enjoying your room service, and probably getting yelled at (for trading) by your significant other, at the same time during your vacation.
Those 2 side panels (monitors) are stored inside the 'case,' making it easy to carry, load and unload. According to OhGizmo.com, this entire unit even runs on battery too! But no words on how many 15-minute candles will the battery last.
Unfortunately, I can't seem to find the suggested retail price! My guess is that it will be in the region of $3k to 4k. But that's just my guess. If anyone knows how much this thing sells, please leave a comment to let everyone knows. Thanks!
060807 - FAF - 15mins - Loss*Paper
 Symbol: FAF
Type: Short
Entry: The 11th bar
Exit: The 17th bar
Result: Gained +0.27%
- I noticed a base was forming at the $51.60 level but I wasn't sold because of the lower shadows formed by the 3rd and 4th bar.
- As soon as the prices broke the low of the 4th bar (blue line), I entered Short
- The 14th bar concerned be because it appeared as a Bullish Piercing signal
- I was cautious after the 14th, and exited my position the moment the prices went above the 5eMA
- My target was the Opening Range Low, which it never made it anyway
060807 - TLAB - 15mins - Loss*Paper
 Symbol: TLAB
Type: Short
Entry: The end of the 16th bar
Exit: The 19th bar
Result: Lost -0.66%
- When the prices broke the base set by the 6th - 9th bar (see blue oval), I wasn't convinced that the setup is good enough because of the lower shadows formed between the 3rd - 5th bar.
- When the prices had the lower shadow of te 3rd - 5th bar covered, I felt that it was too close to the Opening Range Low, which could be the next Resistance Point.
- When the prices broke the Opening Range Low, it left a long lower shadow. I waited to see the prices fell enough to cover the lower shadow of the 15th bar, and I entered.
- I should be awarded for picking the lowest point of the day prize, because my entry price was the lowest price that TLAB ever got for today!
- My Protection Stop was set to right above the 15th bar, and it was reached during the 19th bar.
Thursday, June 7, 2007
060707 - SAI - 15mins - Loss*Paper
 Symbol: SAI
Entry #1: The 7th bar
Exit #1: The end of the 12th bar (Stopped out)
Type: Short
Result: Lost -1.04%
Entry #2: The 19th bar
Exit #2: The 20th bar
Type: Short
Result: Lost -0.61%
- I saw the 3rd - 5th bar all setting a base at the $18.30 level.
- I waited till the price break the low of the 3rd bar lower shadow before entering Short.
- My Protective Stop was above the 6th bar high
- It reached my Protective Stop during the 12th bar
- Since I still believed (don't know why) that the prices will continue to head south, I re-entered another trade at the 19th bar for Short.
- My logic was that a base has been created at the $18.20 level, and I decided to give it another try once the prices broke the $18.20 mark.
- I went Short during the 19th bar.
- But the Protective Stop was triggered once again shortly after.
060707 - MNST - 15mins - Observation

I didn't rade (MNST), but I want to create a post for my future reference. I thought about entering Short when I noticed the bearish signal that is circled. I didn't because I wasn't too sure with myself. That's why I want this post to remind myself that now (paper trading) is the time to try different things!
Wednesday, June 6, 2007
060607 - WFMI - 15mins - Loss*Paper

Symbol: WFMI
Type: Short
Entry: The end of the 6th bar
Exit: The 11th bar
Result: Lost -0.49%
- The 6th bar was, what I thought, a Bearish Engulfing candle, and I entered right before the candle has completed.
- Unfortunately, the prices were not that Bearish afterall. It stayed raletively flat until my Protective Cover was triggered during the 11th bar.
060607 - ACAD - 15mins - Loss*Paper
 Symbol: ACAD
Type: Long
Entry: The beginning of the 7th bar
Exit: Covered during the 9th bar
Result: Lost -0.93%
- What I saw was a bullish candle piercing through a bearish candle
- I took that as I bullish reversal signal and entered Long immediately at the beginning of the next candle
- The lower shadow of the 9th bar triggered the Protective Stop
- Besides, the price did not really rise much during the day
060607 - GFI - 15mins - Loss*Paper
 Symbol: GFI
Type: Short
Entry: The end of the 5th bar
Exit: Covered during the 11th bar
Result: Lost -0.48%
- I was anticipating a bearish run when the prices closed below the Opening Low.
- Instead, maybe I should have entered during the break of the 2nd and 3rd bar low.
- Prices didn't head much further south after I entered
- My Protective Cover was triggered during the 11th bar
060607 - XTO - 15mins - Gain*Paper

Symbol: XTO
Type: Short
Entry: The beginning of the 5th bar
Exits: Mid-way through the 8th bar, and later at around 2pm
Result: Gained +0.27%
- A Base was established during the 2nd to 4th bar
- I entered Short on the break of the 4th bar low
- Exited half my position in the 8th bar when I sensed a Support Level forming with those Lower Shadows
- Exited the remaining half of my position at around 13:45hrs
Subscribe to:
Posts (Atom)


Hi Closet trader,
When I said slow down, I meant I will do less posting because I will be traveling and not spending as much time at my computer.