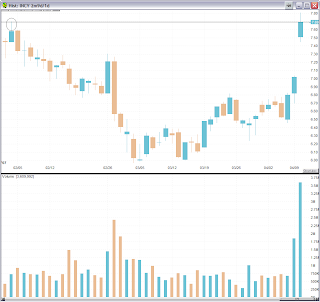
I see a few red flags on INCY:
Long upper shadow on 3rd bar.
Choppy trading especially when I drill down to the 5 minute timeframe.
Resistance dating back to early February at $7.70.
Usually when resistance is just overhead, I wait until resistance is taken out and then try to get in on the retest (ie. resistance becomes support). You entered as price broke resistance on the 10th bar. When it pulled back in and did not hold $7.70 as support, it resulted in a failed breakout and a signal to exit the position.
And since both ADD Traders and Jamie mentioned early February high, I am also attaching the daily chart below, to point out what they are referring to.
 Once again, I want to express my million thanks to these 2 individuals, who are willing to take time to respond to my inquiry. Thanks!


No comments:
Post a Comment